 Please could you tell all answers clearly? I mean a= 99 and its graph is b , bla bla , thank you for your work.
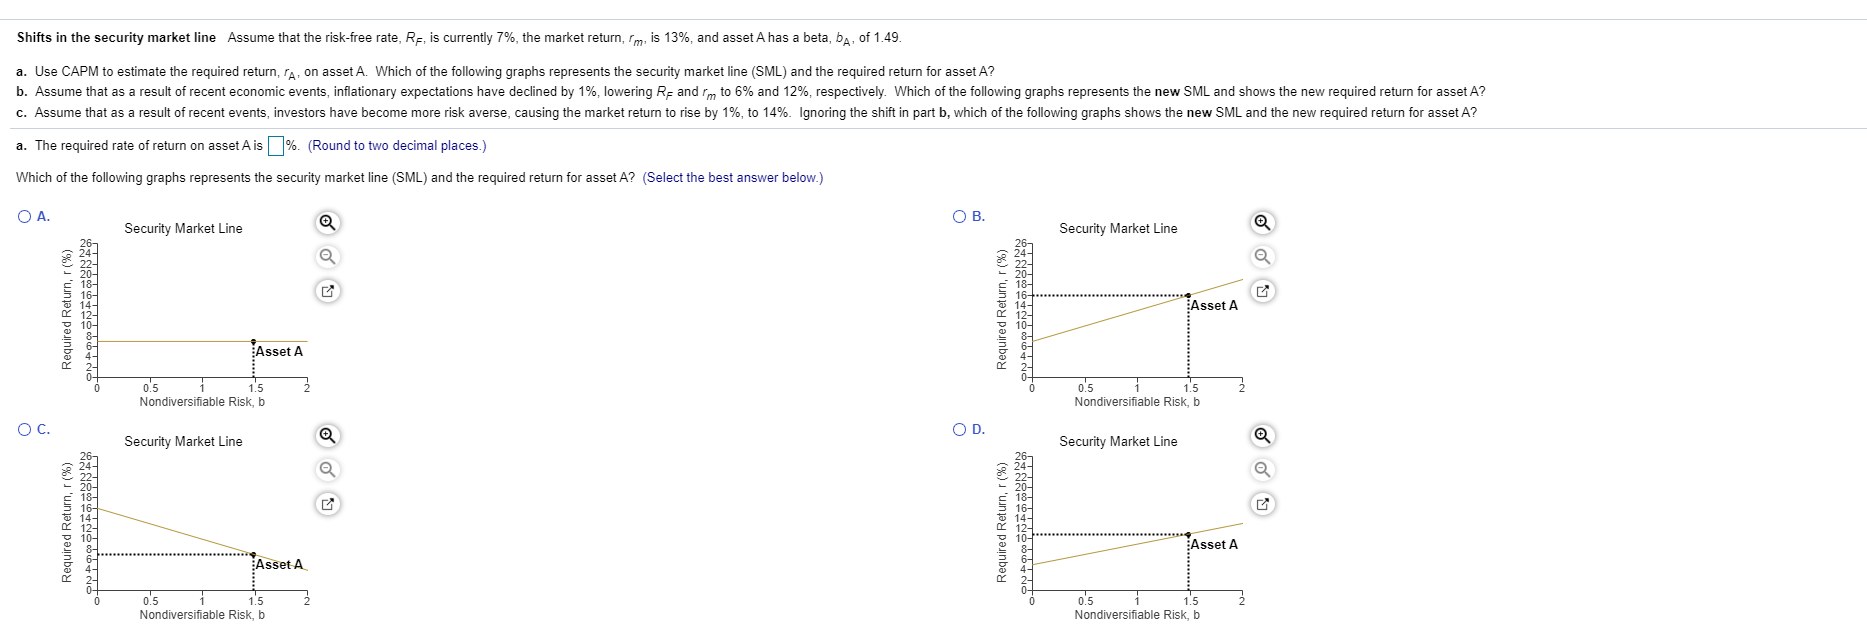
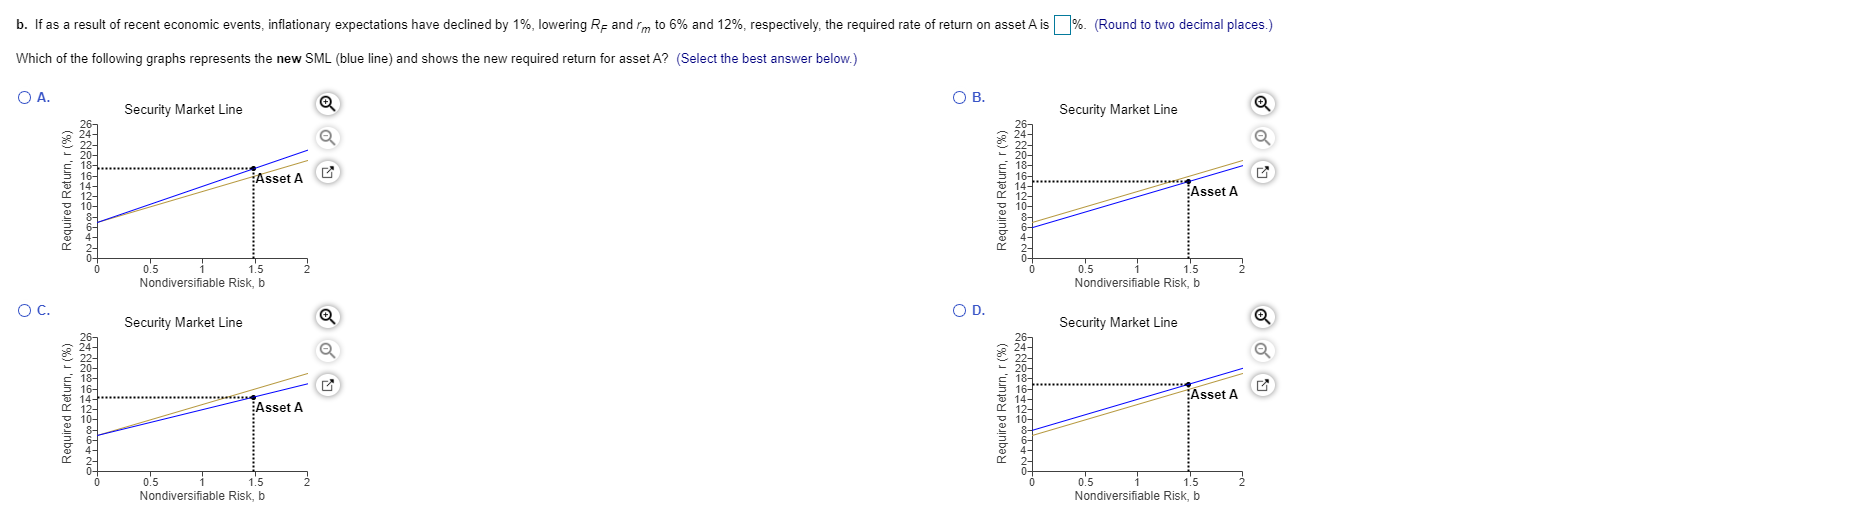
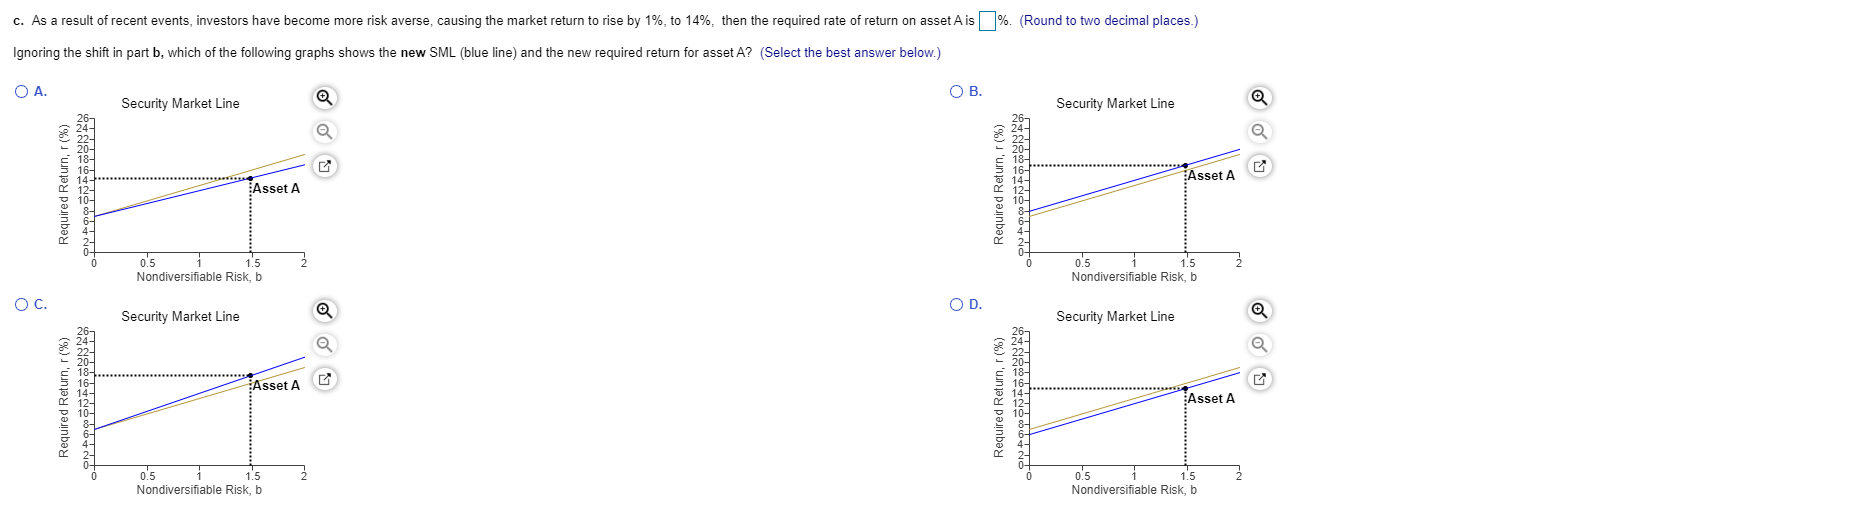
Shifts in the security market line Assume that the risk-free rate, RF, is currently 7%, the market return, rm, is 13%, and asset A has a beta, ba, of 1.49. a. Use CAPM to estimate the required return, ra, on asset A. Which of the following graphs represents the security market line (SML) and the required return for asset A? b. Assume that as a result of recent economic events, inflationary expectations have declined by 1%, lowering Re and rm to 6% and 12%, respectively. Which of the following graphs represents the new SML and shows the new required return for asset A? c. Assume that as a result of recent events, investors have become more risk averse, causing the market return to rise by 1%, to 14%. Ignoring the shift in part b, which of the following graphs shows the new SML and the new required return for asset A? a. The required rate of return on asset A is %. (Round to two decimal places.) Which of the following graphs represents the security market line (SML) and the required return for asset A? (Select the best answer below.) OA. Security Market Line Security Market Line Required Return, r(%) Required Return, r(%) Asset A Asset A 1.5 Nondiversifiable Risk, b 2 0.5 1. 52 Nondiversifiable Risk, b Security Market Line Security Market Line Required Return, r(%) Required Return, r(%) Asset A Asset A 0.5 05 1.5 Nondiversifiable Risk, b 1.5 Nondiversifiable Risk, b b. If as a result of recent economic events, inflationary expectations have declined by 1%, lowering RF and rm to 6% and 12%, respectively, the required rate of return on asset Ais %. (Round to two decimal places.) Which of the following graphs represents the new SML (blue line) and shows the new required return for asset A? (Select the best answer below.) OA. Security Market Line Security Market Line Asset A Required Return, r(%) Required Return, r (%) Asset A 0.5 1.5 Nondiversifiable Risk, b 0.5 Nondiversifiable Risk, b 1.5 Security Market Line Security Market Line Asset A Required Return, r(%) Asset A Required Return, r(%) + 0.5 1.5 Nondiversifiable Risk, b 0.5 1 1.5 Nondiversifiable Risk, b 2 c. As a result of recent events, investors have become more risk averse, causing the market return to rise by 1%, to 14%, then the required rate of return on asset A is %. (Round to two decimal places.) Ignoring the shift in part b, which of the following graphs shows the new SML (blue line) and the new required return for asset A? (Select the best answer below.) OA. Security Market Line Security Market Line Asset A Required Return, r(%) - Asset A Required Return, r(%) + 0.5 1.5 Nondiversifiable Risk, b 0.5 1.5 Nondiversifiable Risk, b Security Market Line Security Market Line Asset A Required Return, r (%) O OU + Required Return, r(%) Asset A - 0.5 1 1 .5 Nondiversifiable Risk, b 1.5 Nondiversifiable Risk, b