

Answered step by step
Verified Expert Solution
Question
1 Approved Answer
please creat an excel spreasheet and show work for the problem below! (2pages) 3. (30%) A one-month stock selling price raw data is given as
please creat an excel spreasheet and show work for the problem below!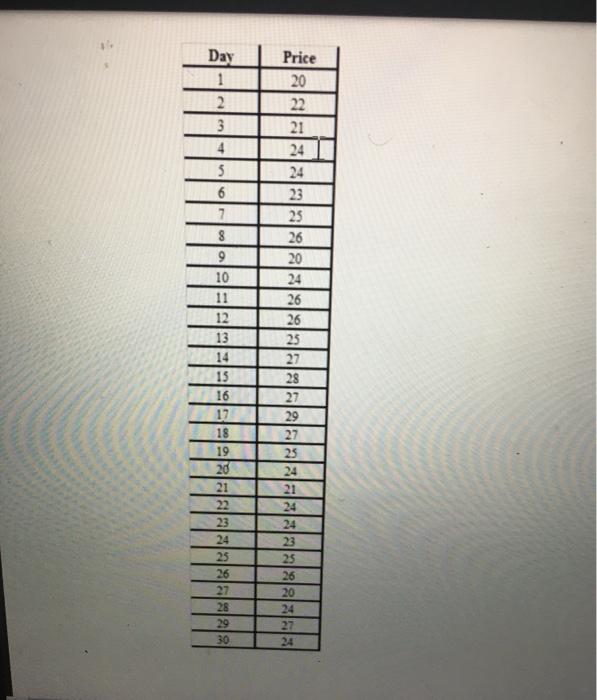
3. (30%) A one-month stock selling price raw data is given as follows. Plot the price of each day. Demonstrate a price tendency using a 5-day moving average technique and plot this tendency as curve on the same chart (Note: you need to input original data in your spreadsheet and to demonstrate your moving average work). The plot should contain proper title, label, legend, curve and data formatting/representation, axis title, etc. Day 1 2 3 4 5 9 7 8 9 10 11 12 13 Taalaala 16 17 AAA 20 21 22 23 24 25 26 27 30 (2pages) 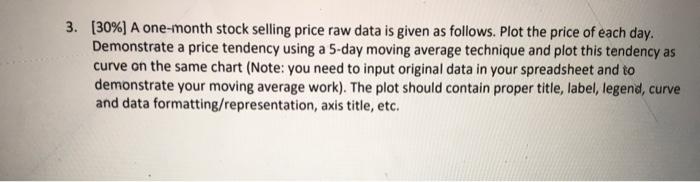
Step by Step Solution
There are 3 Steps involved in it
Step: 1

Get Instant Access to Expert-Tailored Solutions
See step-by-step solutions with expert insights and AI powered tools for academic success
Step: 2

Step: 3
Ace Your Homework with AI
Get the answers you need in no time with our AI-driven, step-by-step assistance
Get Started
Understanding financial statements
Authors: Lyn M. Fraser, Aileen Ormiston
9th Edition
136086241, 978-0136086246