

Answered step by step
Verified Expert Solution
Question
1 Approved Answer
please create a chart showcasing the growth rate and explain how you got it begin{tabular}{|l|r|r|r|} hline & 2019 & 2020 & 2021 hline Total
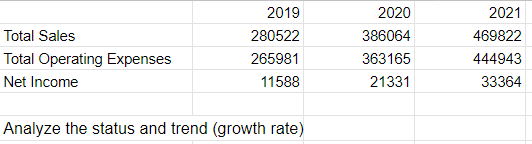
please create a chart showcasing the growth rate and explain how you got it
\begin{tabular}{|l|r|r|r|} \hline & 2019 & 2020 & 2021 \\ \hline Total Sales & 280522 & 386064 & 469822 \\ \hline Total Operating Expenses & 265981 & 363165 & 444943 \\ \hline Net Income & 11588 & 21331 & 33364 \\ \hline \end{tabular} Analyze the status and trend (growth rate)Step by Step Solution
There are 3 Steps involved in it
Step: 1

Get Instant Access to Expert-Tailored Solutions
See step-by-step solutions with expert insights and AI powered tools for academic success
Step: 2

Step: 3
Ace Your Homework with AI
Get the answers you need in no time with our AI-driven, step-by-step assistance
Get Started
Audit Risk Alert Employee Benefit Plans Industry Developments 2019
Authors: AICPA
1st Edition
1948306867, 978-1948306867