

Question
Please create code in MATLAB for histogram and more and solve these questions too take your time David Holben (a-4) studied selenium levels in beef
Please create code in MATLAB for histogram and more and solve these questions too take your time
David Holben (a-4) studied selenium levels in beef raised in a low selenium region of the United States. The goal of the study was to compare selenium levels in the region-raised beef to selenium levels in cooked venison, squirrel, and beef from other regions of the United States. are the selenium levels calculated on a dry weight basis in micrograms /100 grams for a sample of 53 region-raised cattle.The data is below put two images of the data because the first image is a bit small
(a) Use these data to construct: A frequency distribution
A relative frequency distribution A cumulative frequency distribution A cumulative relative frequency distributions A histogram A frequency polygon
(b) Describe these data with respect to symmetry and skewness. (c) How many of the measurements are greater than 40? (d) What percentage of the measurements are less than 25?

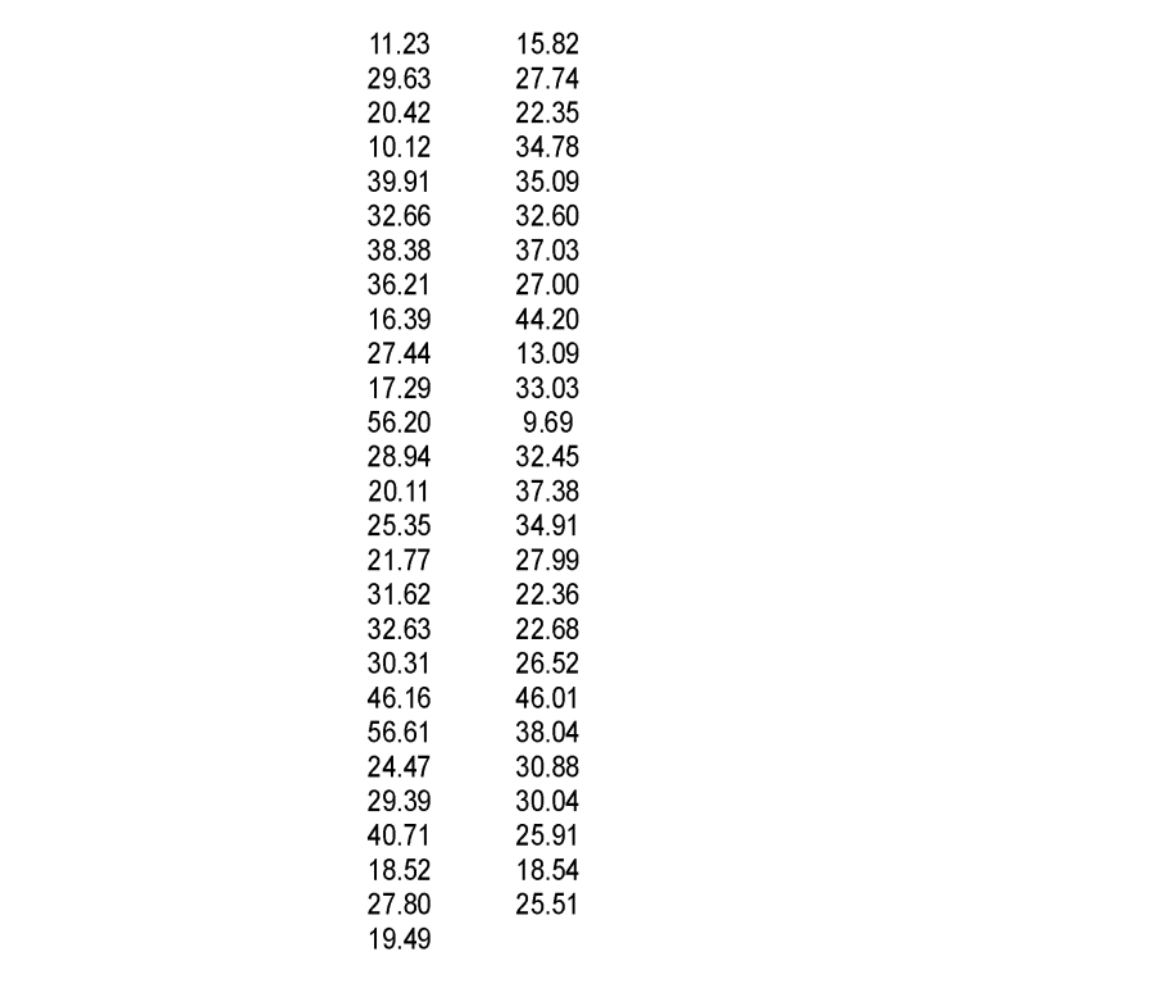
\begin{tabular}{cc} 11.23 & 15.82 \\ 29.63 & 27.74 \\ 20.42 & 22.35 \\ 10.12 & 34.78 \\ 39.91 & 35.09 \\ 32.66 & 32.60 \\ 38.38 & 37.03 \\ 36.21 & 27.00 \\ 16.39 & 44.20 \\ 27.44 & 13.09 \\ 17.29 & 33.03 \\ 56.20 & 9.69 \\ 28.94 & 32.45 \\ 20.11 & 37.38 \\ 25.35 & 34.91 \\ 21.77 & 27.99 \\ 31.62 & 22.36 \\ 32.63 & 22.68 \\ 30.31 & 26.52 \\ 46.16 & 46.01 \\ 56.61 & 38.04 \\ 24.47 & 30.88 \\ 29.39 & 30.04 \\ 40.71 & 25.91 \\ 18.52 & 18.54 \\ 27.80 & 25.51 \\ 19.49 & \\ \hline \end{tabular} \begin{tabular}{cc} 11.23 & 15.82 \\ 29.63 & 27.74 \\ 20.42 & 22.35 \\ 10.12 & 34.78 \\ 39.91 & 35.09 \\ 32.66 & 32.60 \\ 38.38 & 37.03 \\ 36.21 & 27.00 \\ 16.39 & 44.20 \\ 27.44 & 13.09 \\ 17.29 & 33.03 \\ 56.20 & 9.69 \\ 28.94 & 32.45 \\ 20.11 & 37.38 \\ 25.35 & 34.91 \\ 21.77 & 27.99 \\ 31.62 & 22.36 \\ 32.63 & 22.68 \\ 30.31 & 26.52 \\ 46.16 & 46.01 \\ 56.61 & 38.04 \\ 24.47 & 30.88 \\ 29.39 & 30.04 \\ 40.71 & 25.91 \\ 18.52 & 18.54 \\ 27.80 & 25.51 \\ 19.49 & \\ \hline \end{tabular}
Step by Step Solution
There are 3 Steps involved in it
Step: 1

Get Instant Access to Expert-Tailored Solutions
See step-by-step solutions with expert insights and AI powered tools for academic success
Step: 2

Step: 3
Ace Your Homework with AI
Get the answers you need in no time with our AI-driven, step-by-step assistance
Get Started
Data Analysis Using SQL And Excel
Authors: Gordon S Linoff
2nd Edition
111902143X, 9781119021438