

Question
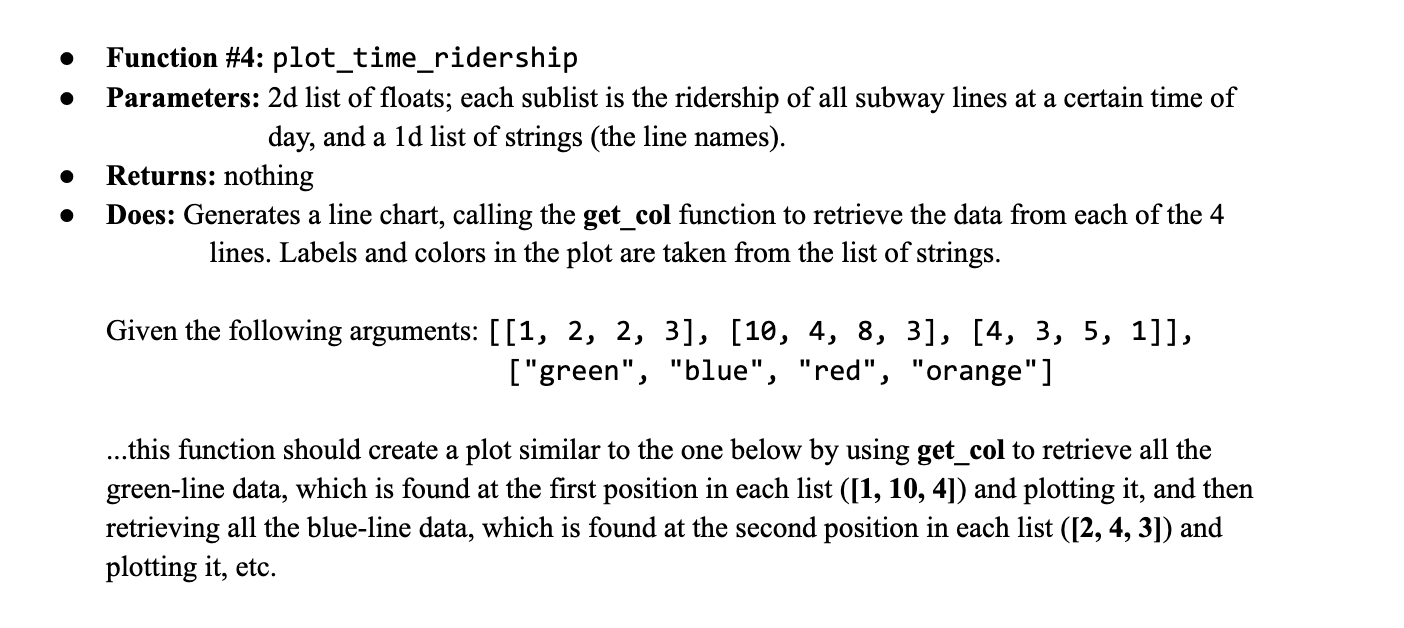
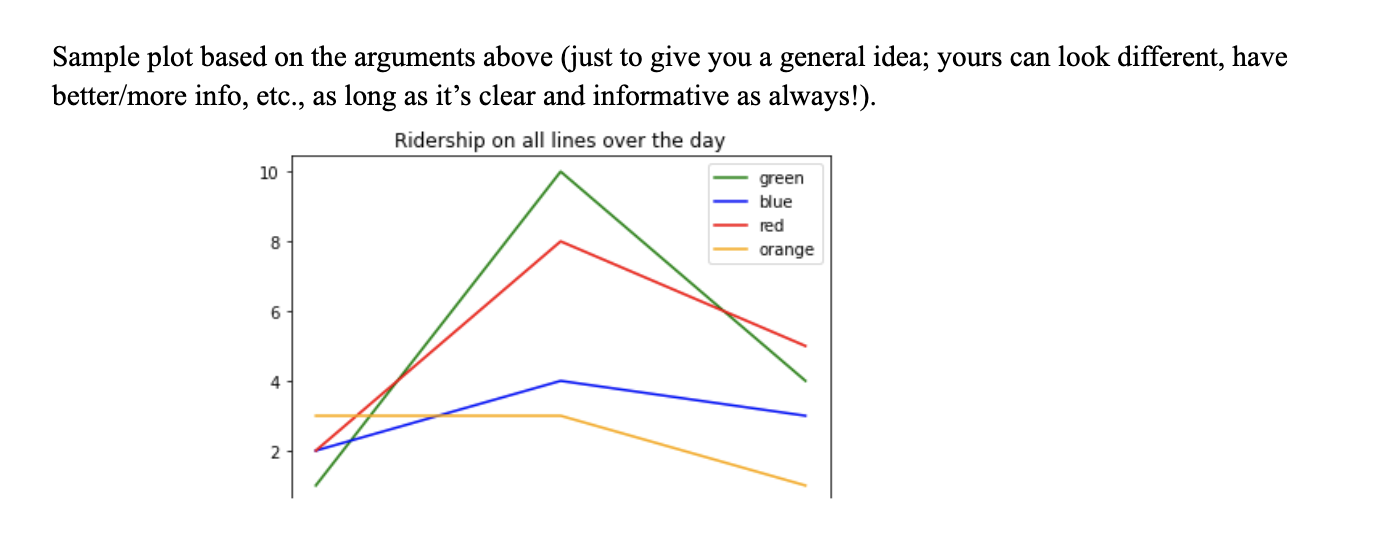
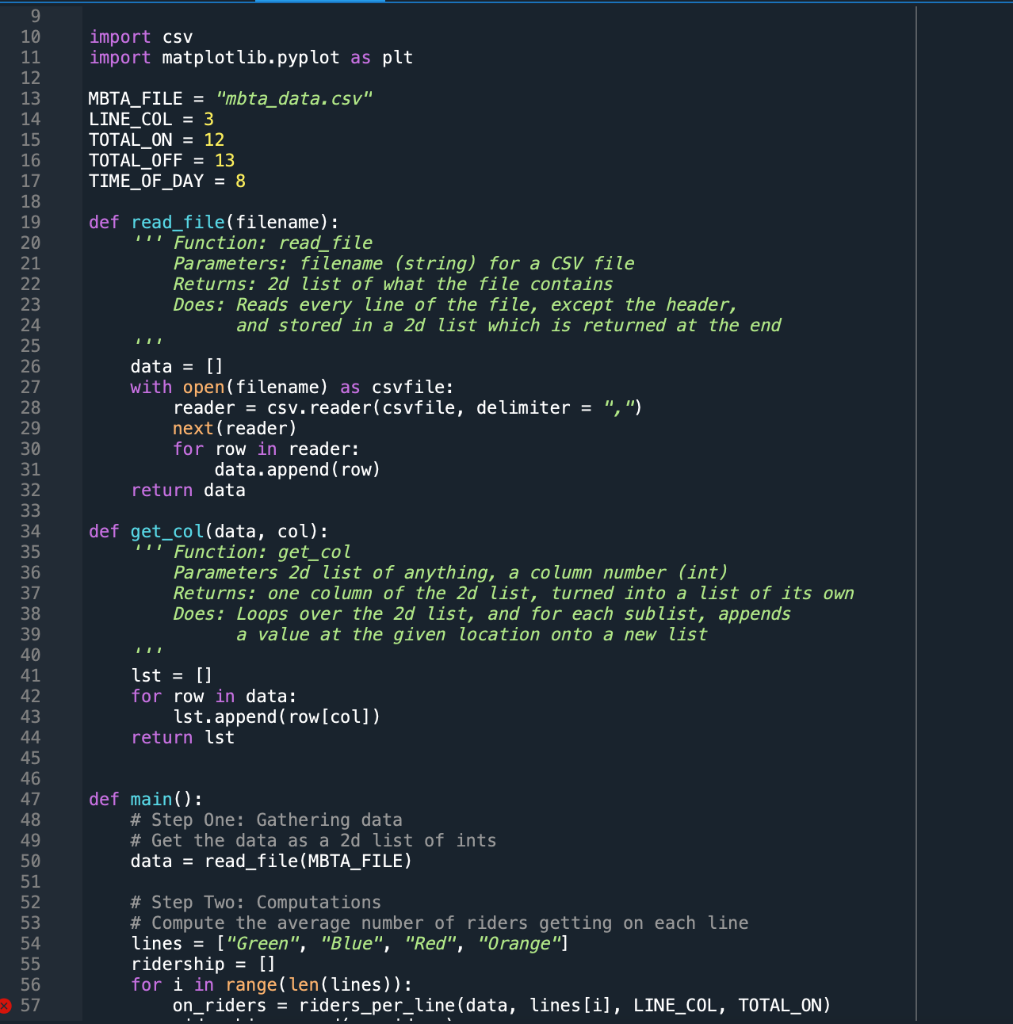
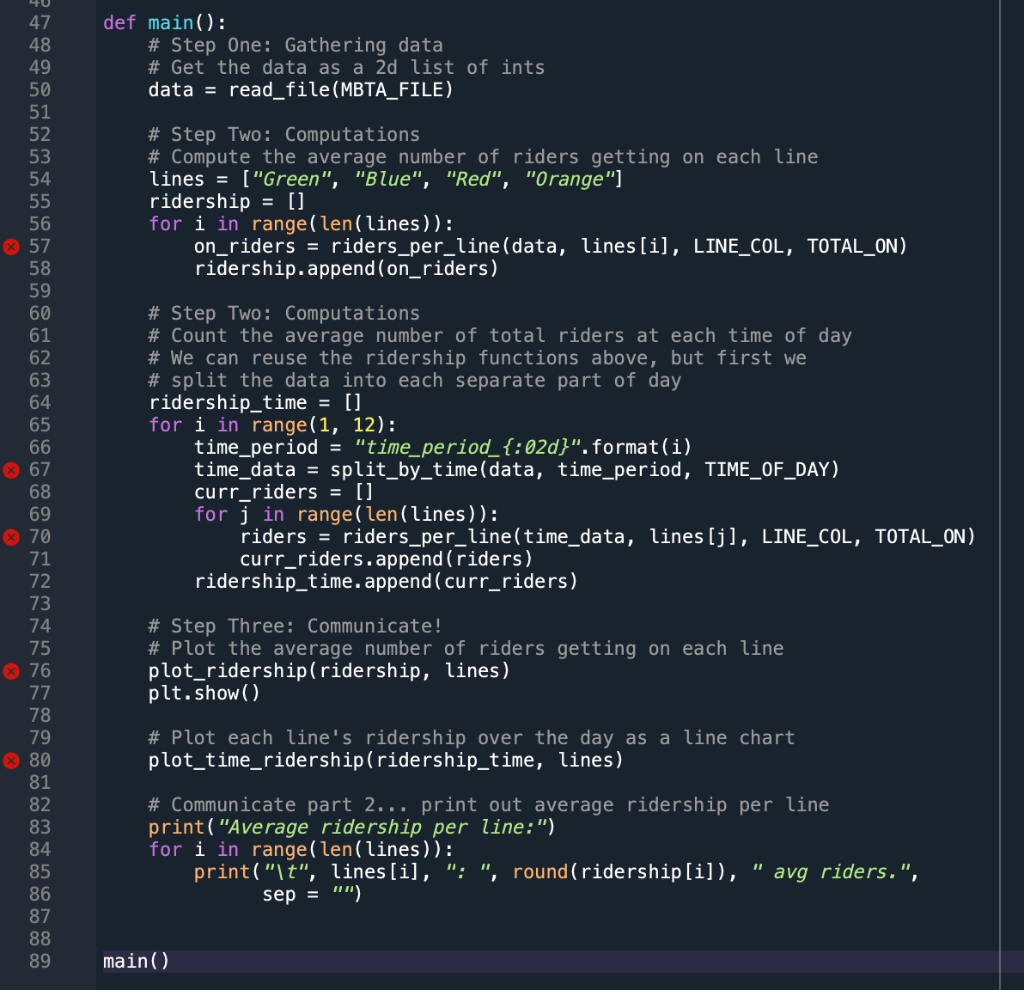
Please create four new functions in the starter code based on these instructions. Thank you so much! Update: all the instructions and new functions should
Please create four new functions in the starter code based on these instructions. Thank you so much!
Update: all the instructions and new functions should be working for starter code to make sure the computation part can run
Step by Step Solution
There are 3 Steps involved in it
Step: 1

Get Instant Access to Expert-Tailored Solutions
See step-by-step solutions with expert insights and AI powered tools for academic success
Step: 2

Step: 3
Ace Your Homework with AI
Get the answers you need in no time with our AI-driven, step-by-step assistance
Get Started
Building The Data Warehouse
Authors: W. H. Inmon
4th Edition
0764599445, 978-0764599446