Please determine Inventory Turnover and Days' Sales for the 2018 Annual report for Best Buy
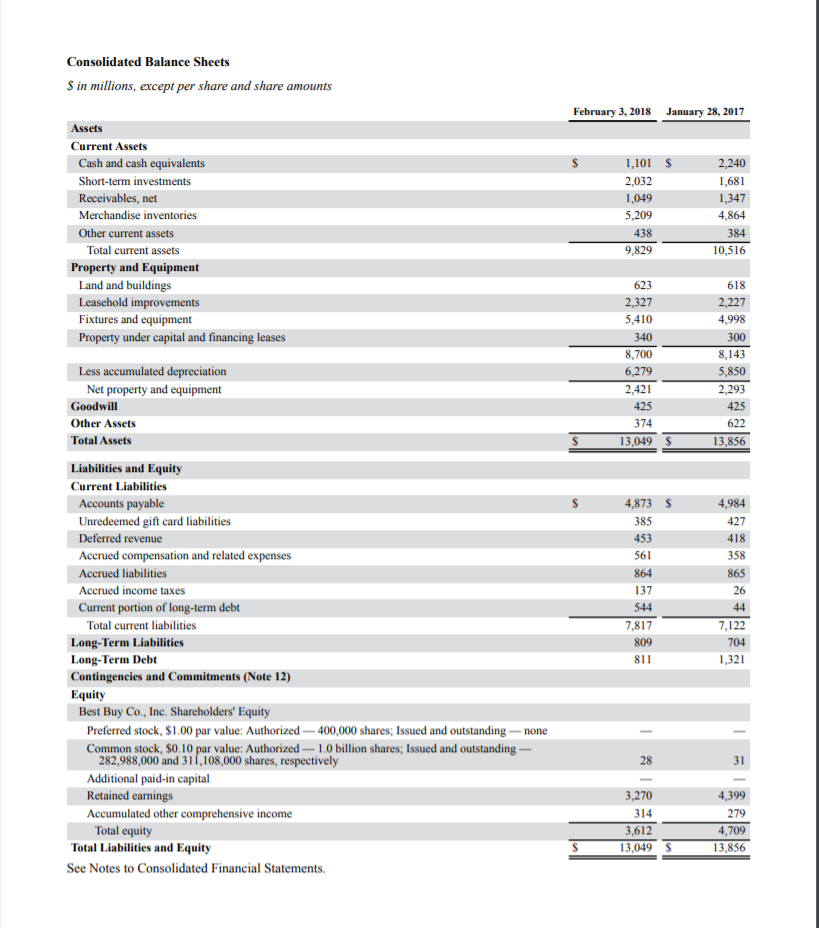
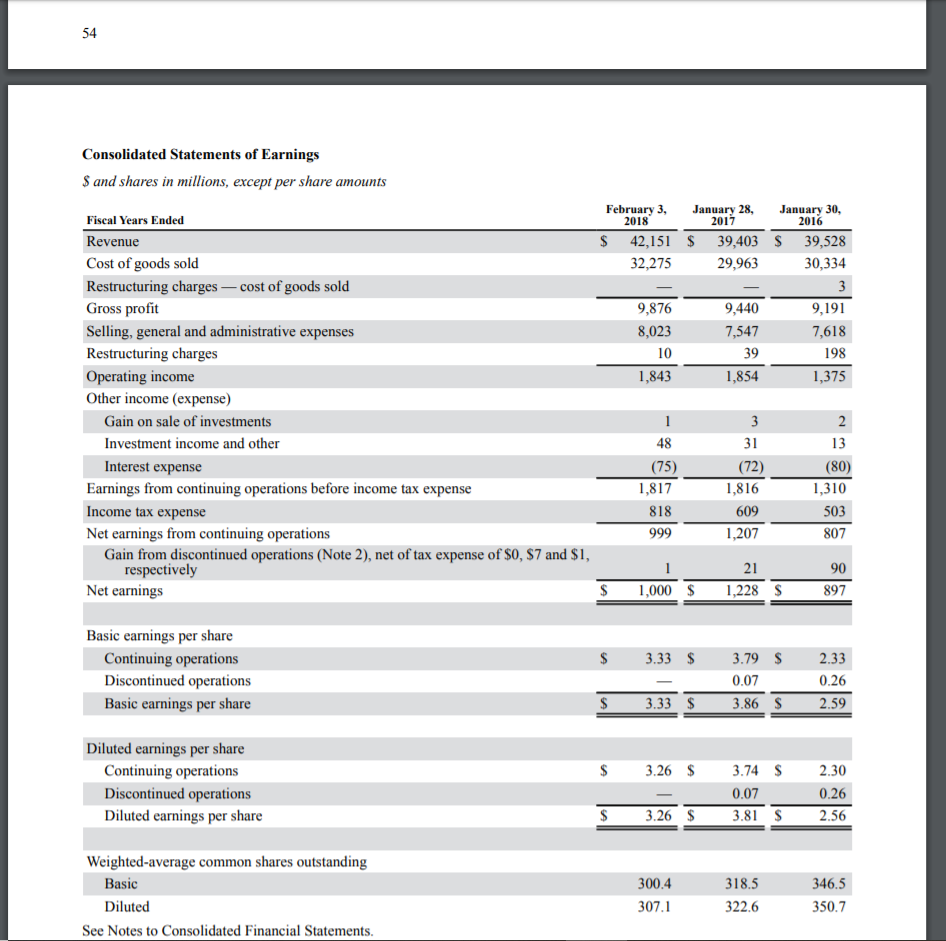
Consolidated Balance Sheets $ in millions, except per share and share amounts February 3, 2018 January 28, 2017 $ Assets Current Assets Cash and cash equivalents Short-term investments Receivables, net Merchandise inventories Other current assets Total current assets Property and Equipment Land and buildings Leasehold improvements Fixtures and equipment Property under capital and financing leases 1,101 2,032 1,049 5,209 438 2,240 1,681 1,347 4,864 384 10,516 9,829 623 2,327 5,410 340 8,700 6,279 2,421 425 374 13,049 618 2,227 4,998 300 8,143 5,850 2,293 425 622 13,856 Less accumulated depreciation Net property and equipment Goodwill Other Assets Total Assets $ 4,873 385 453 561 864 137 544 7,817 809 811 4,984 427 418 358 865 26 7,122 704 1,321 Liabilities and Equity Current Liabilities Accounts payable Unredeemed gift card liabilities Deferred revenue Accrued compensation and related expenses Accrued liabilities Accrued income taxes Current portion of long-term debt Total current liabilities Long-Term Liabilities Long-Term Debt Contingencies and Commitments (Note 12) Equity Best Buy Co., Inc. Shareholders' Equity Preferred stock, $1.00 par value: Authorized - 400,000 shares, Issued and outstanding none Common stock, $0.10 par value: Authorized - 1.0 billion shares; Issued and outstanding - 282,988,000 and 311,108,000 shares, respectively Additional paid-in capital Retained earnings Accumulated other comprehensive income Total equity Total Liabilities and Equity See Notes to Consolidated Financial Statements. 3,270 314 3,612 13,049 4,399 279 4,709 13,856 Consolidated Statements of Earnings $ and shares in millions, except per share amounts February 3, January 28, January 30, 2018 2017 2016 $ 42,151 $ 39,403 $ 39,528 32,275 29,963 30,334 - 3 9,876 9,440 9,191 8,023 7,547 7,618 10 198 1,843 1,854 1,375 39 Fiscal Years Ended Revenue Cost of goods sold Restructuring charges - cost of goods sold Gross profit Selling, general and administrative expenses Restructuring charges Operating income Other income (expense) Gain on sale of investments Investment income and other Interest expense Earnings from continuing operations before income tax expense Income tax expense Net earnings from continuing operations Gain from discontinued operations (Note 2), net of tax expense of $0, $7 and $1, respectively Net earnings 2 1 48 3 31 (72) 1,816 (80) (75) 1.817 1,310 609 818 999 503 807 1,207 2190 1,228 $ 897 $ 1,000 $ $ Basic earnings per share Continuing operations Discontinued operations Basic earnings per share 3.33 $ - 3.33 $ 3.79$ 0.07 3.86 S 2.33 0.26 2.59 $ $ 3.26 $ Diluted earnings per share Continuing operations Discontinued operations Diluted earnings per share 3.74 $ 0.07 3.81 $ 2.30 0.26 2.56 $ 3.26 $ Weighted average common shares outstanding Basic Diluted See Notes to Consolidated Financial Statements. 300.4 307. 1 318.5 3 22.6 346.5 350.7