 Please do Amazon
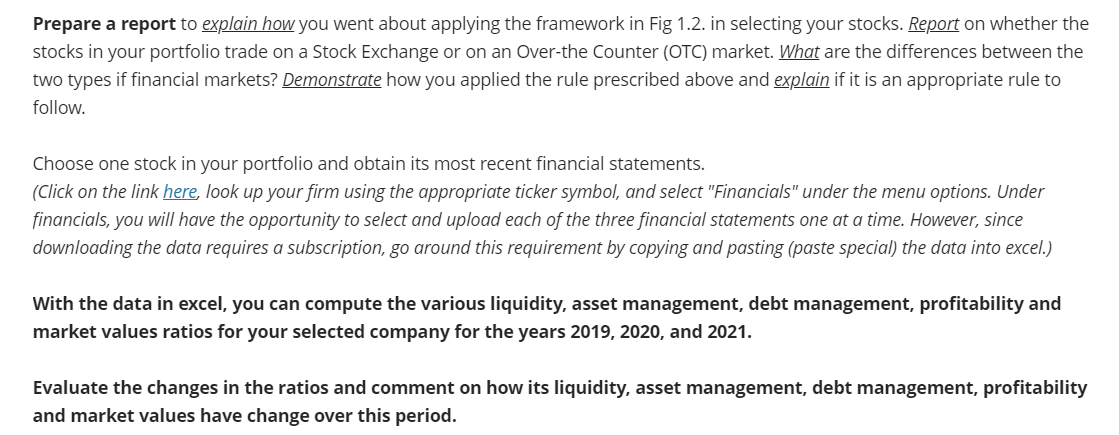
Prepare a report to explain how you went about applying the framework in Fig 1.2. in selecting your stocks. Report on whether the stocks in your portfolio trade on a Stock Exchange or on an Over-the Counter (OTC) market. What are the differences between the two types if financial markets? Demonstrate how you applied the rule prescribed above and explain if it is an appropriate rule to follow. Choose one stock in your portfolio and obtain its most recent financial statements. (Click on the link here look up your firm using the appropriate ticker symbol, and select "Financials" under the menu options. Under financials, you will have the opportunity to select and upload each of the three financial statements one at a time. However, since downloading the data requires a subscription, go around this requirement by copying and pasting (paste special) the data into excel.) With the data in excel, you can compute the various liquidity, asset management, debt management, profitability and market values ratios for your selected company for the years 2019, 2020, and 2021. Evaluate the changes in the ratios and comment on how its liquidity, asset management, debt management, profitability and market values have change over this period. Prepare a report to explain how you went about applying the framework in Fig 1.2. in selecting your stocks. Report on whether the stocks in your portfolio trade on a Stock Exchange or on an Over-the Counter (OTC) market. What are the differences between the two types if financial markets? Demonstrate how you applied the rule prescribed above and explain if it is an appropriate rule to follow. Choose one stock in your portfolio and obtain its most recent financial statements. (Click on the link here look up your firm using the appropriate ticker symbol, and select "Financials" under the menu options. Under financials, you will have the opportunity to select and upload each of the three financial statements one at a time. However, since downloading the data requires a subscription, go around this requirement by copying and pasting (paste special) the data into excel.) With the data in excel, you can compute the various liquidity, asset management, debt management, profitability and market values ratios for your selected company for the years 2019, 2020, and 2021. Evaluate the changes in the ratios and comment on how its liquidity, asset management, debt management, profitability and market values have change over this period
 Please do Amazon


