

Answered step by step
Verified Expert Solution
Question
1 Approved Answer
please do calculations STARBUCKS CORPORATION CONSOLIDATED BALANCE SHEETS (in millions, except per share data) ASSETS Cash and cash equivalents Short-term investments Accounts receivable, net Inventories
please do calculations
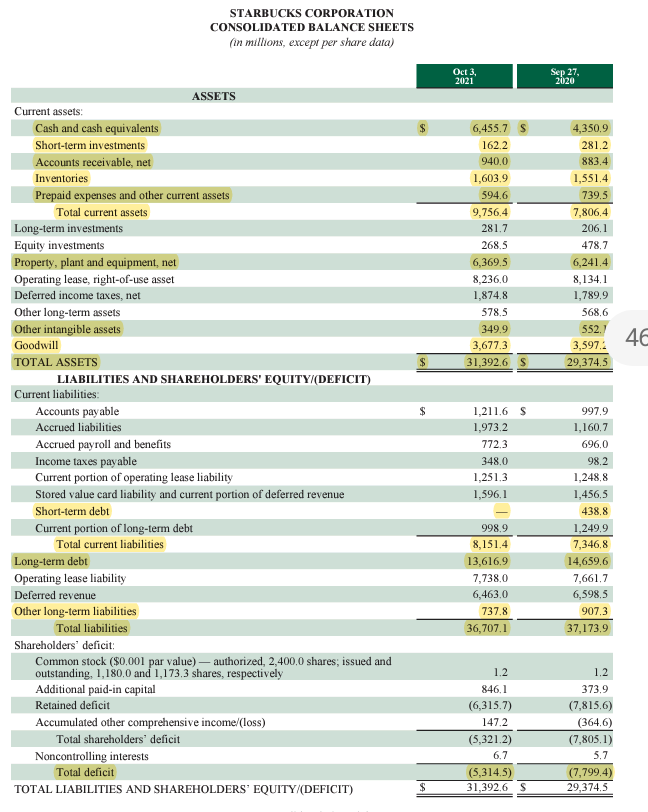
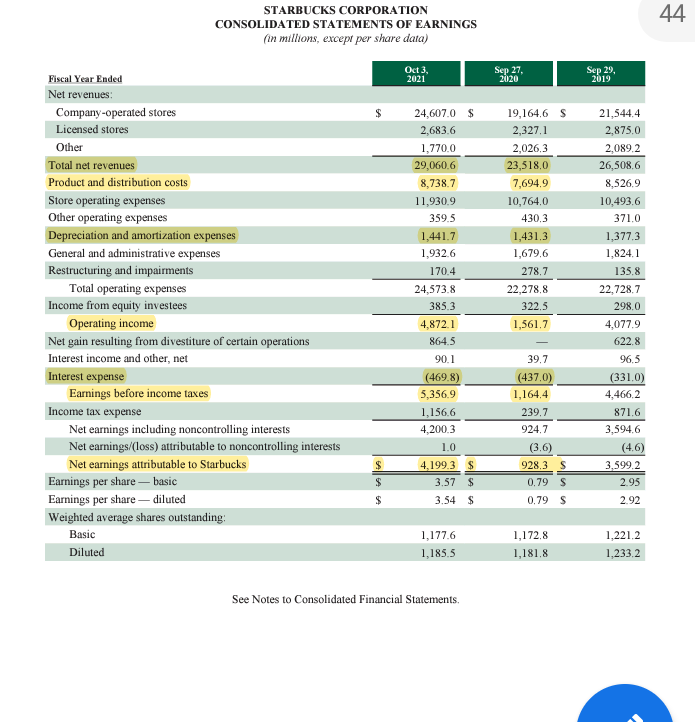
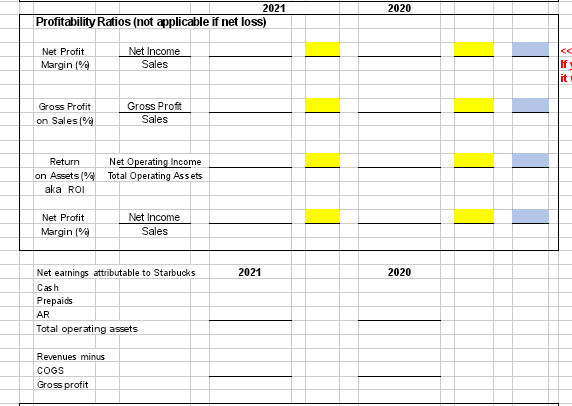
STARBUCKS CORPORATION CONSOLIDATED BALANCE SHEETS (in millions, except per share data) ASSETS Cash and cash equivalents Short-term investments Accounts receivable, net Inventories Prepaid expenses and other current assets Total current assets Long-term investments Equity investments Property, plant and equipment, net Operating lease, right-of-use asset Deferred income taxes, net Other long-term assets Other intangible assets Goodwill TOTAL ASSETS Current liabilities: Current assets: LIABILITIES AND SHAREHOLDERS' EQUITY/(DEFICIT) Accounts payable Accrued liabilities Accrued payroll and benefits Income taxes payable Current portion of operating lease liability Stored value card liability and current portion of deferred revenue Short-term debt Current portion of long-term debt Total current liabilities Long-term debt Operating lease liability Deferred revenue Other long-term liabilities Total liabilities Shareholders' deficit: Common stock ($0,001 par value) - authorized, 2,400,0 shares; issued and outstanding, 1,180,0 and 1,173.3 shares, respectively Additional paid-in capital Retained deficit Accumulated other comprehensive income/(loss) Total shareholders' deficit Noncontrolling interests Total deficit TOTAL LIABILITIES AND SHAREHOLDERS' EQUITY/(DEFICIT) $ $ Oct 3, 2021 6,455.7 S 162,2 940,0 1,603.9 594.6 9,756,4 281.7 268.5 6,369.5 8,236,0 1,874.8 578.5 349,9 3,677.3 31,392.6 S 1,211.6 S 1,973.2 772.3 348,0 1,251.3 1,596,1 998.9 8,151.4 13,616.9 7,738,0 6,463.0 737,8 36,707.1 1.2 846.1 (6,315.7) 147.2 (5,321.2) 6.7 (5,314.5) 31,392.6 S Sep 27, 2020 4,350,9 281.2 883.4 1,551,4 739.5 7,806.4 206,1 478,7 6,241.4 8,134.1 1,789.9 568,6 552, 46 3,597,2 29,374.5 997,9 1,160,7 696.0 98,2 1,248,8 1,456,5 438.8 1,249,9 7,346,8 14,659,6 7,661,7 6,598,5 907.3 37,173,9 1.2 373.9 (7,815,6) (364.6) (7,805.1) 5.7 (7,799.4) 29,374.5 STARBUCKS CORPORATION CONSOLIDATED STATEMENTS OF EARNINGS (in millions, except per share data) Oct 3, 2021 Fiscal Year Ended Net revenues: Company-operated stores Licensed stores Other Total net revenues Product and distribution costs Store operating expenses Other operating expenses Depreciation and amortization expenses General and administrative expenses Restructuring and impairments Total operating expenses Income from equity investees Operating income Net gain resulting from divestiture of certain operations Interest income and other, net Interest expense Earnings before income taxes Income tax expense Net earnings including noncontrolling interests Net earnings/(loss) attributable to noncontrolling interests Net earnings attributable to Starbucks Earnings per share-basic Earnings per share-diluted Weighted average shares outstanding: Basic Diluted $ 24,607.0 $ 2,683.6 1,770.0 29,060.6 8,738.7 11,930.9 359.5 1,441.7 1,932.6 170,4 24,573.8 385.3 4,872.1 864.5 90.1 (469.8) 5,356.9 1,156.6 4,200.3 1.0 4,199.3 $ 3.57 $ 3.54 $ 1,177.6 1,185.5 See Notes to Consolidated Financial Statements. Sep 27, 2020 19,164,6 S 2,327,1 2,026,3 23,518,0 7,694.9 10,764.0 430.3 1,431.3 1,679,6 278,7 22,278,8 322.5 1,561,7 39.7 (437,0) 1,164.4 239,7 924.7 (3.6) 928.3 S 0.79 S 0.79 S 1,172,8 1,181,8 Sep 29, 2019 21,544.4 2,875.0 2,089.2 26,508,6 8,526.9 10,493.6 371.0 1,377.3 1,824.1 135.8 22,728.7 298.0 4,077.9 622.8 96.5 (331.0) 4,466.2 871.6 3,594.6 3,599.2 2.95 2.92 1,221.2 1,233,2 (4.6) 44 2021 Profitability Ratios (not applicable if net loss) Net Profit Net Income Sales Margin (%) Gross Profit Gross Proft on Sales (%) Sales Return Net Operating Income Total Operating Assets on Assets (%) aka ROI Net Profit Net Income Sales Margin (%) Net earnings attributable to Starbucks Cash Prepaids AR Total operating assets Revenues minus COGS Gross profit 2021 2020 2020 If it
Step by Step Solution
There are 3 Steps involved in it
Step: 1

Get Instant Access to Expert-Tailored Solutions
See step-by-step solutions with expert insights and AI powered tools for academic success
Step: 2

Step: 3
Ace Your Homework with AI
Get the answers you need in no time with our AI-driven, step-by-step assistance
Get Started
The Truth About Day Trading Brutal Reality For Beginner Traders
Authors: Joe Soldi
1st Edition
1542456053, 978-1542456050