please do calculations that can be figured out without the experiment data
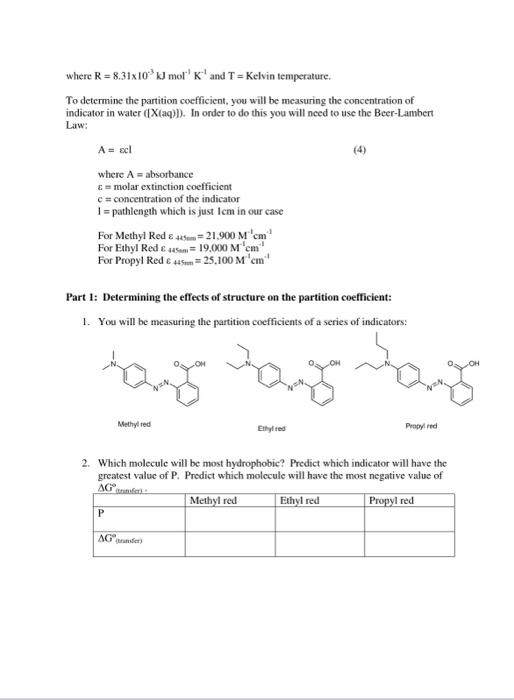
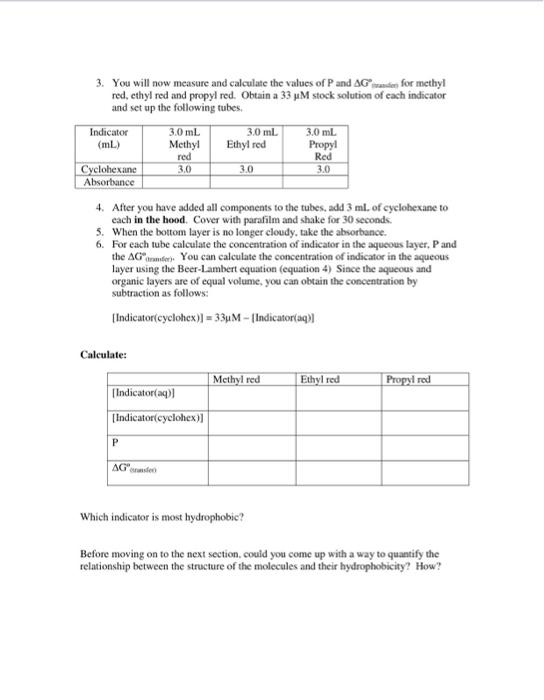
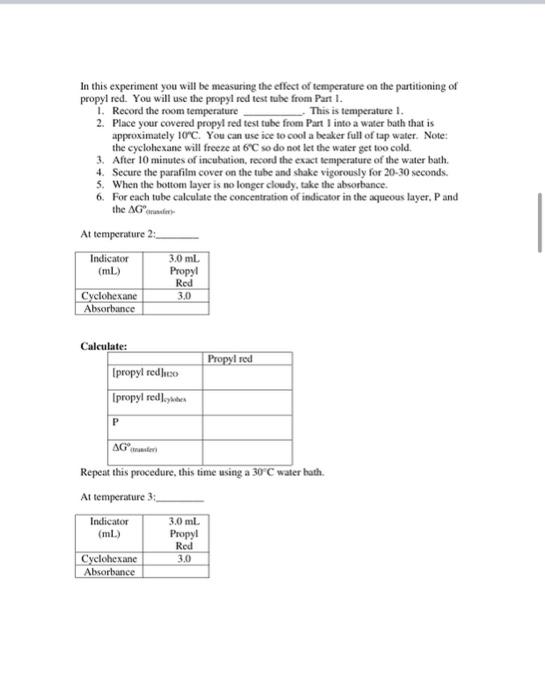
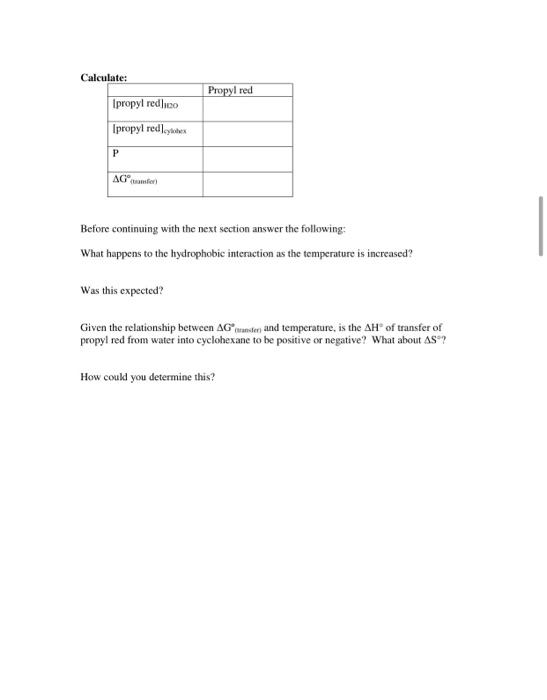
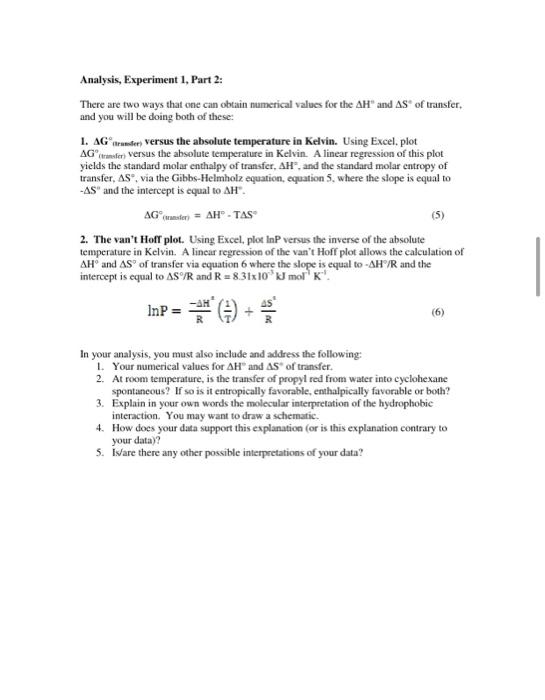
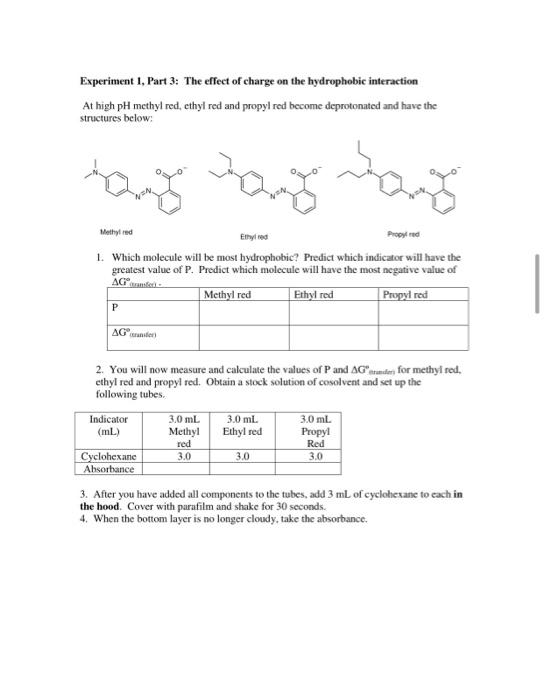
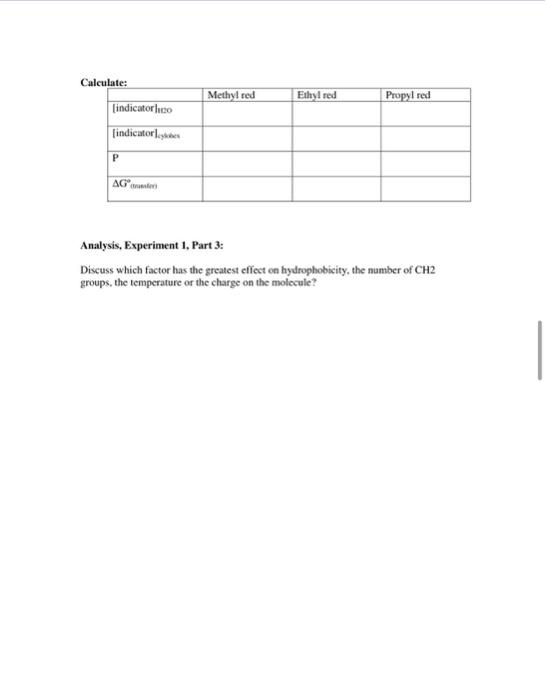
Student Handouts Background: (Please refer to your textbook. Nelson and Cox 5 cl. 2008 p.42) The hydrophobic interaction governs many biochemical phenomena, including the assembly of biological membranes, the folding of proteins, and the absorption and distribution of drug and toxin molecules within an organism. Different molecules have different degrees of hydrophobicity. You have been taught that molecules composed of primarily aliphatic and aromatic groups tend to be hydrophobic, whereas those with charged groups or many hydrogen bond donors and acceptors tend to be more hydrophilic. You have also been taught that the hydrophobic interaction does not stem from intrinsically strong interactions between hydrophobic molecules, but rather the tendency of water molecules towards greatest entropy. This seems to make sense but how do we know this? In other words, how is hydrophobicity actually measured experimentally? Experiment 1: Structure/hydrophobicity relationships It turns out there is a way to measure hydrophobicity experimentally. This is done using a partitioning experiment. That is: 1) Dissolve the molecule of interest in water 2) Add a layer of organic solvent. 3) Shake the mixture. During shaking, the molecule of interest partitions (moves back and forth) between the aqueous and organic layers and establishes equilibrium concentrations in each layer. 4) Measure the concentration of the molecule in each layer. 5) From this we can obtain two numerical values that reflect the hydrophobicity of a molecule. P, the partition coefficient, and Grande This week we will be measuring the partition coefficient of several indicator molecules using a spectrophotometer. The partitioning of a molecule (X) is governed by the following equilibrium and partition coefficient (P) in equations 1 and 2 respectively X(aq) X(org) [x(org)] IX(aq)] The partition coefficient is simply the equilibrium constant of the reaction given below. and can be obtained by measuring the concentration of indicator in cach phase of the equilibrium mixture. From this we can calculate the standard transfer free energy AGwater The AG transfer is the free energy change that accompanies the transfer of I mol of indicator from the aqueous layer to the organic layer. The free energy change can be calculated as follows: AG-RT In P where R = 8,31x10 kJ mol' K'and T = Kelvin temperature, To determine the partition coefficient, you will be measuring the concentration of indicator in water (IX(aq)]). In order to do this you will need to use the Beer-Lambert Law A = ecl where A = absorbance E = molar extinction coefficient c = concentration of the indicator 1 = pathlength which is just lcm in our case For Methyl Red E46 = 21.900 Mcm For Ethyl Red = 19.000 Mcm For Propyl Red & 445 = 25.100 M 'em! Part 1: Determining the effects of structure on the partition coefficient: 1. You will be measuring the partition coefficients of a series of indicators: wan Methylred Ethylted Propyired 2. Which molecule will be most hydrophobic? Predict which indicator will have the greatest value of P. Predict which molecule will have the most negative value of Methyl red Ethyl red Propyl red AG P AG Red 3. You will now measure and calculate the values of P and AG for methyl red, ethyl red and propyl red. Obtain a 33 M stock solution of each indicator and set up the following tubes, Indicator 3.0 mL 3.0 ml. 3.0 mL (mL) Methyl Ethyl red Propy! red Cyclohexane 3.0 3.0 3.0 Absortance 4. After you have added all components to the tubes, add 3 ml. of cyclohexane to cach in the hood. Cover with parafilm and shake for 30 seconds. 5. When the bottom layer is no longer cloudy, take the absorbance. 6. For each tube calculate the concentration of indicator in the aqueous layer. Pand the AG) You can calculate the concentration of indicator in the aqueous layer using the Beer-Lambert equation (equation 4) Since the aqueous and organic layers are of equal volume, you can obtain the concentration by subtraction as follows: Indicatorcyclohex)) = 334M - Indicator(aq) Calculate: Methyl red Indicator(aq)] Indicator cyclohex)] Ethyl red Propyl red P AG oder Which indicator is most hydrophobic? Before moving on to the next section, could you come up with a way to quantify the relationship between the structure of the molecules and their hydrophobicity? How? Analysis, Experiment 1, Part 1: Of course, it turns out that one can quantify the effect of structure on the hydrophobicity. As you notice the only difference between the molecules are the lengths of the alkyl chains attached to the non-azo nitrogen. Specifically, each molecule has a different number of CH, groups. Using Excel, construct a plot of AG vader versus the number of CH; groups in the molecule. Note that methyl red has no CH, groups. ethyl red has 2 CH, groups, and propyl red has 4 CH, groups. Do a linear regression of this data. The slope is the change in transfer free energy per CH: group. As part of your analysis you must also include a discussion that addresses the following points: 1. Which molecule was the most hydrophobic? 2. Was this expected? 3. What is the numerical relationship between the hydrophobicity and the number of CH, groups in the molecule? 4. How does this value compare with the value of -3.5 kJ/mol per CH2 group given in many textbooks? What could be some reasons for any discrepancies? Experiment 1, Part 2: The effect of temperature on the hydrophobic interaction. Recall the thermodynamic explanation of the hydrophobic interaction--the ordered Water/clathrate cage model. When propyl red is dissolved in water, how do water molecules at the alkyl chain surface of propyl red interact with propyl red and/or with each other? Draw a schematic of a propyl group dissolved in water. What would happen to these water molecules if the propyl group above moved into the cyclohexane layer? Given this would you expect the AH of transfer of propyl red from water into cyclohexane to be positive or negative? What about the AS of transfer? How will the strength of the hydrophobic interaction change with increasing temperature? In this experiment you will be measuring the effect of temperature on the partitioning of propyl red. You will use the propyl red test tube from Part 1. 1. Record the room temperature This is temperature 1. 2. Place your covered propyl red test tube from Part I into a water bath that is approximately 10c. You can use ice to cool a beaker full of tap water. Note: the cyclohexane will freeze at 6C so do not let the water get too cold. 3. After 10 minutes of incubation, record the exact temperature of the water bath. 4. Secure the parafilm cover on the tube and shake vigorously for 20-30 seconds. 5. When the bottom layer is no longer cloudy, take the absorbance. 6. For each tube calculate the concentration of indicator in the aqueous layer. Pand the AG At temperature 2: Indicator 3.0 ml (mL) Propyl Red Cyclohexane 3.0 Absorbance Calculate: Propyl red (propyl redio [propyl red, AGwen Repeat this procedure, this time using a 30C water bath. At temperature 3 Indicator (ml.) 3.0 mL Propy! Red 3.0 Cyclohexane Absorbance Calculate: Propyl red Ipropyl redio Ipropyl rede P AG Before continuing with the next section answer the following: What happens to the hydrophobic interaction as the temperature is increased! Was this expected? Given the relationship between AGwander and temperature, is the AH of transfer of propyl red from water into cyclohexane to be positive or negative? What about AS ? How could you determine this? Analysis, Experiment 1, Part 2: There are two ways that one can obtain numerical values for the AH" and As of transfer, and you will be doing both of these: 1. AG frunter versus the absolute temperature in Kelvin. Using Excel, plot AG (trofee versus the absolute temperature in Kelvin A linear regression of this plot yields the standard molar enthalpy of transfer, AH". and the standard molar entropy of transfer, As, via the Gibbs-Helmholz equation, equation 5, where the slope is equal to -AS" and the intercept is equal to AH". AGcafer=AH-TAS (5) 2. The van't Hoff plot. Using Excel, plot InP versus the inverse of the absolute temperature in Kelvin. A linear regression of the van't Hoff plot allows the calculation of AH and AS of transfer via equation 6 where the slope is equal to -AH/R and the intercept is equal to AS /R and R = 8.31x10W mol'k' InP (6) In your analysis, you must also include and address the following: 1. Your numerical values for AH and As of transfer. 2. At room temperature, is the transfer of propyl red from water into cyclohexane spontaneous? If so is it entropically favorable, enthalpically favorable or both? 3. Explain in your own words the molecular interpretation of the hydrophobie interaction. You may want to draw a schematic. 4. How does your data support this explanation (or is this explanation contrary to your data) 5. is/are there any other possible interpretations of your data? Experiment I, Part 3: The effect of charge on the hydrophobic interaction At high pH methyl red, ethyl red and propyl red become deprotonated and have the structures below: tanto nang man Methyred Ethylted Propyled 1. Which molecule will be most hydrophobic? Predict which indicator will have the greatest value of P. Predict which molecule will have the most negative value of AG Methyl red Ethyl red Propyl red P AG 2. You will now measure and calculate the values of P and AG stunder, for methyl red, ethyl red and propyl red. Obtain a stock solution of cosolvent and set up the following tubes. Indicator 3.0 mL 3.0 ml 3.0 mL (ml) Methyl Ethyl red Propyl red Red Cyclohexane 3.0 3.0 3.0 Absorbance 3. After you have added all components to the tubes, add 3 mL of cyclohexane to each in the hood. Cover with parafilm and shake for 30 seconds. 4. When the bottom layer is no longer cloudy, take the absorbance. Methyl red Ethyl red Propyl red Calculate: [indicatorhino indicator P AG Analysis, Experiment 1, Part 3: Discuss which factor has the greatest effect on hydrophobicity, the number of CH2 groups, the temperature or the charge on the molecule? Student Handouts Background: (Please refer to your textbook. Nelson and Cox 5 cl. 2008 p.42) The hydrophobic interaction governs many biochemical phenomena, including the assembly of biological membranes, the folding of proteins, and the absorption and distribution of drug and toxin molecules within an organism. Different molecules have different degrees of hydrophobicity. You have been taught that molecules composed of primarily aliphatic and aromatic groups tend to be hydrophobic, whereas those with charged groups or many hydrogen bond donors and acceptors tend to be more hydrophilic. You have also been taught that the hydrophobic interaction does not stem from intrinsically strong interactions between hydrophobic molecules, but rather the tendency of water molecules towards greatest entropy. This seems to make sense but how do we know this? In other words, how is hydrophobicity actually measured experimentally? Experiment 1: Structure/hydrophobicity relationships It turns out there is a way to measure hydrophobicity experimentally. This is done using a partitioning experiment. That is: 1) Dissolve the molecule of interest in water 2) Add a layer of organic solvent. 3) Shake the mixture. During shaking, the molecule of interest partitions (moves back and forth) between the aqueous and organic layers and establishes equilibrium concentrations in each layer. 4) Measure the concentration of the molecule in each layer. 5) From this we can obtain two numerical values that reflect the hydrophobicity of a molecule. P, the partition coefficient, and Grande This week we will be measuring the partition coefficient of several indicator molecules using a spectrophotometer. The partitioning of a molecule (X) is governed by the following equilibrium and partition coefficient (P) in equations 1 and 2 respectively X(aq) X(org) [x(org)] IX(aq)] The partition coefficient is simply the equilibrium constant of the reaction given below. and can be obtained by measuring the concentration of indicator in cach phase of the equilibrium mixture. From this we can calculate the standard transfer free energy AGwater The AG transfer is the free energy change that accompanies the transfer of I mol of indicator from the aqueous layer to the organic layer. The free energy change can be calculated as follows: AG-RT In P where R = 8,31x10 kJ mol' K'and T = Kelvin temperature, To determine the partition coefficient, you will be measuring the concentration of indicator in water (IX(aq)]). In order to do this you will need to use the Beer-Lambert Law A = ecl where A = absorbance E = molar extinction coefficient c = concentration of the indicator 1 = pathlength which is just lcm in our case For Methyl Red E46 = 21.900 Mcm For Ethyl Red = 19.000 Mcm For Propyl Red & 445 = 25.100 M 'em! Part 1: Determining the effects of structure on the partition coefficient: 1. You will be measuring the partition coefficients of a series of indicators: wan Methylred Ethylted Propyired 2. Which molecule will be most hydrophobic? Predict which indicator will have the greatest value of P. Predict which molecule will have the most negative value of Methyl red Ethyl red Propyl red AG P AG Red 3. You will now measure and calculate the values of P and AG for methyl red, ethyl red and propyl red. Obtain a 33 M stock solution of each indicator and set up the following tubes, Indicator 3.0 mL 3.0 ml. 3.0 mL (mL) Methyl Ethyl red Propy! red Cyclohexane 3.0 3.0 3.0 Absortance 4. After you have added all components to the tubes, add 3 ml. of cyclohexane to cach in the hood. Cover with parafilm and shake for 30 seconds. 5. When the bottom layer is no longer cloudy, take the absorbance. 6. For each tube calculate the concentration of indicator in the aqueous layer. Pand the AG) You can calculate the concentration of indicator in the aqueous layer using the Beer-Lambert equation (equation 4) Since the aqueous and organic layers are of equal volume, you can obtain the concentration by subtraction as follows: Indicatorcyclohex)) = 334M - Indicator(aq) Calculate: Methyl red Indicator(aq)] Indicator cyclohex)] Ethyl red Propyl red P AG oder Which indicator is most hydrophobic? Before moving on to the next section, could you come up with a way to quantify the relationship between the structure of the molecules and their hydrophobicity? How? Analysis, Experiment 1, Part 1: Of course, it turns out that one can quantify the effect of structure on the hydrophobicity. As you notice the only difference between the molecules are the lengths of the alkyl chains attached to the non-azo nitrogen. Specifically, each molecule has a different number of CH, groups. Using Excel, construct a plot of AG vader versus the number of CH; groups in the molecule. Note that methyl red has no CH, groups. ethyl red has 2 CH, groups, and propyl red has 4 CH, groups. Do a linear regression of this data. The slope is the change in transfer free energy per CH: group. As part of your analysis you must also include a discussion that addresses the following points: 1. Which molecule was the most hydrophobic? 2. Was this expected? 3. What is the numerical relationship between the hydrophobicity and the number of CH, groups in the molecule? 4. How does this value compare with the value of -3.5 kJ/mol per CH2 group given in many textbooks? What could be some reasons for any discrepancies? Experiment 1, Part 2: The effect of temperature on the hydrophobic interaction. Recall the thermodynamic explanation of the hydrophobic interaction--the ordered Water/clathrate cage model. When propyl red is dissolved in water, how do water molecules at the alkyl chain surface of propyl red interact with propyl red and/or with each other? Draw a schematic of a propyl group dissolved in water. What would happen to these water molecules if the propyl group above moved into the cyclohexane layer? Given this would you expect the AH of transfer of propyl red from water into cyclohexane to be positive or negative? What about the AS of transfer? How will the strength of the hydrophobic interaction change with increasing temperature? In this experiment you will be measuring the effect of temperature on the partitioning of propyl red. You will use the propyl red test tube from Part 1. 1. Record the room temperature This is temperature 1. 2. Place your covered propyl red test tube from Part I into a water bath that is approximately 10c. You can use ice to cool a beaker full of tap water. Note: the cyclohexane will freeze at 6C so do not let the water get too cold. 3. After 10 minutes of incubation, record the exact temperature of the water bath. 4. Secure the parafilm cover on the tube and shake vigorously for 20-30 seconds. 5. When the bottom layer is no longer cloudy, take the absorbance. 6. For each tube calculate the concentration of indicator in the aqueous layer. Pand the AG At temperature 2: Indicator 3.0 ml (mL) Propyl Red Cyclohexane 3.0 Absorbance Calculate: Propyl red (propyl redio [propyl red, AGwen Repeat this procedure, this time using a 30C water bath. At temperature 3 Indicator (ml.) 3.0 mL Propy! Red 3.0 Cyclohexane Absorbance Calculate: Propyl red Ipropyl redio Ipropyl rede P AG Before continuing with the next section answer the following: What happens to the hydrophobic interaction as the temperature is increased! Was this expected? Given the relationship between AGwander and temperature, is the AH of transfer of propyl red from water into cyclohexane to be positive or negative? What about AS ? How could you determine this? Analysis, Experiment 1, Part 2: There are two ways that one can obtain numerical values for the AH" and As of transfer, and you will be doing both of these: 1. AG frunter versus the absolute temperature in Kelvin. Using Excel, plot AG (trofee versus the absolute temperature in Kelvin A linear regression of this plot yields the standard molar enthalpy of transfer, AH". and the standard molar entropy of transfer, As, via the Gibbs-Helmholz equation, equation 5, where the slope is equal to -AS" and the intercept is equal to AH". AGcafer=AH-TAS (5) 2. The van't Hoff plot. Using Excel, plot InP versus the inverse of the absolute temperature in Kelvin. A linear regression of the van't Hoff plot allows the calculation of AH and AS of transfer via equation 6 where the slope is equal to -AH/R and the intercept is equal to AS /R and R = 8.31x10W mol'k' InP (6) In your analysis, you must also include and address the following: 1. Your numerical values for AH and As of transfer. 2. At room temperature, is the transfer of propyl red from water into cyclohexane spontaneous? If so is it entropically favorable, enthalpically favorable or both? 3. Explain in your own words the molecular interpretation of the hydrophobie interaction. You may want to draw a schematic. 4. How does your data support this explanation (or is this explanation contrary to your data) 5. is/are there any other possible interpretations of your data? Experiment I, Part 3: The effect of charge on the hydrophobic interaction At high pH methyl red, ethyl red and propyl red become deprotonated and have the structures below: tanto nang man Methyred Ethylted Propyled 1. Which molecule will be most hydrophobic? Predict which indicator will have the greatest value of P. Predict which molecule will have the most negative value of AG Methyl red Ethyl red Propyl red P AG 2. You will now measure and calculate the values of P and AG stunder, for methyl red, ethyl red and propyl red. Obtain a stock solution of cosolvent and set up the following tubes. Indicator 3.0 mL 3.0 ml 3.0 mL (ml) Methyl Ethyl red Propyl red Red Cyclohexane 3.0 3.0 3.0 Absorbance 3. After you have added all components to the tubes, add 3 mL of cyclohexane to each in the hood. Cover with parafilm and shake for 30 seconds. 4. When the bottom layer is no longer cloudy, take the absorbance. Methyl red Ethyl red Propyl red Calculate: [indicatorhino indicator P AG Analysis, Experiment 1, Part 3: Discuss which factor has the greatest effect on hydrophobicity, the number of CH2 groups, the temperature or the charge on the molecule