Please do help me answer the following activities below and follow the given pages in order for easy format. Will rate you helpful thank you.
Please do help me answer the following activities below and follow the given pages in order for easy format. Will rate you helpful thank you.
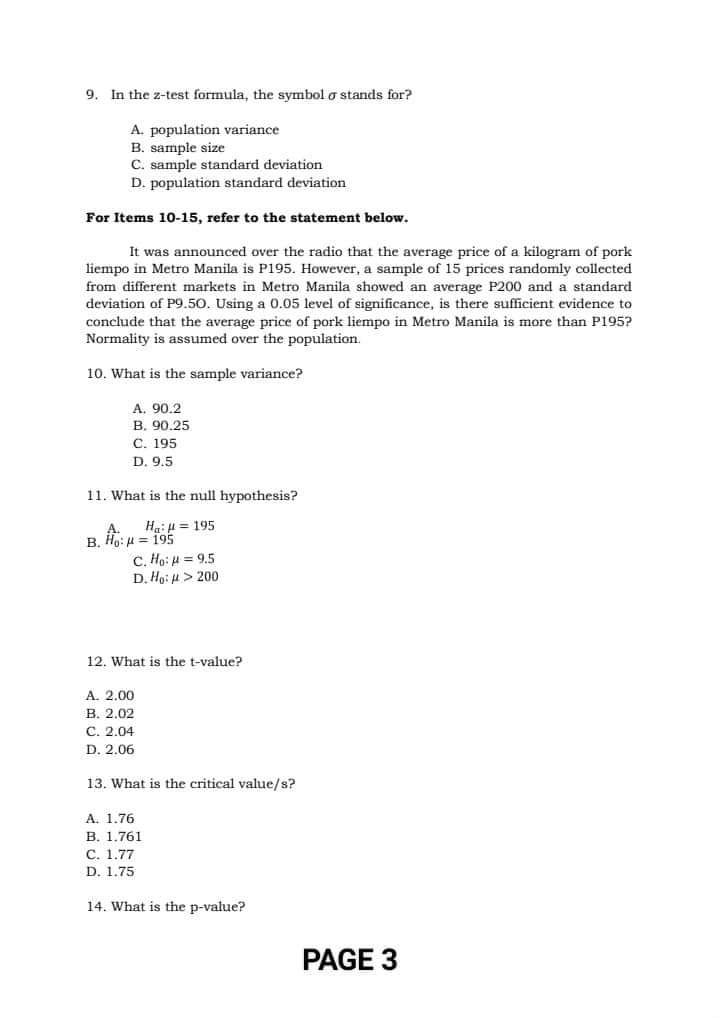
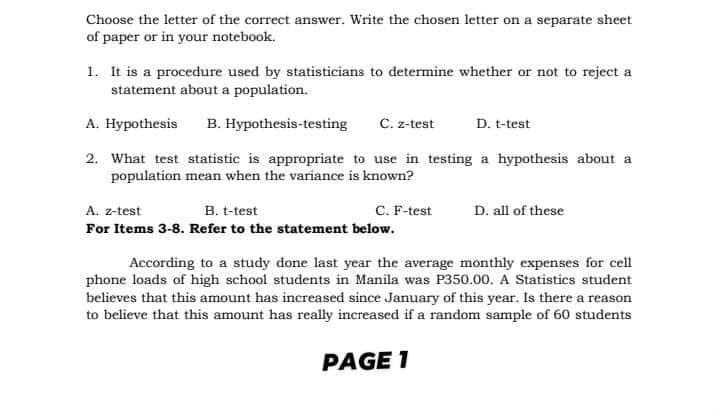
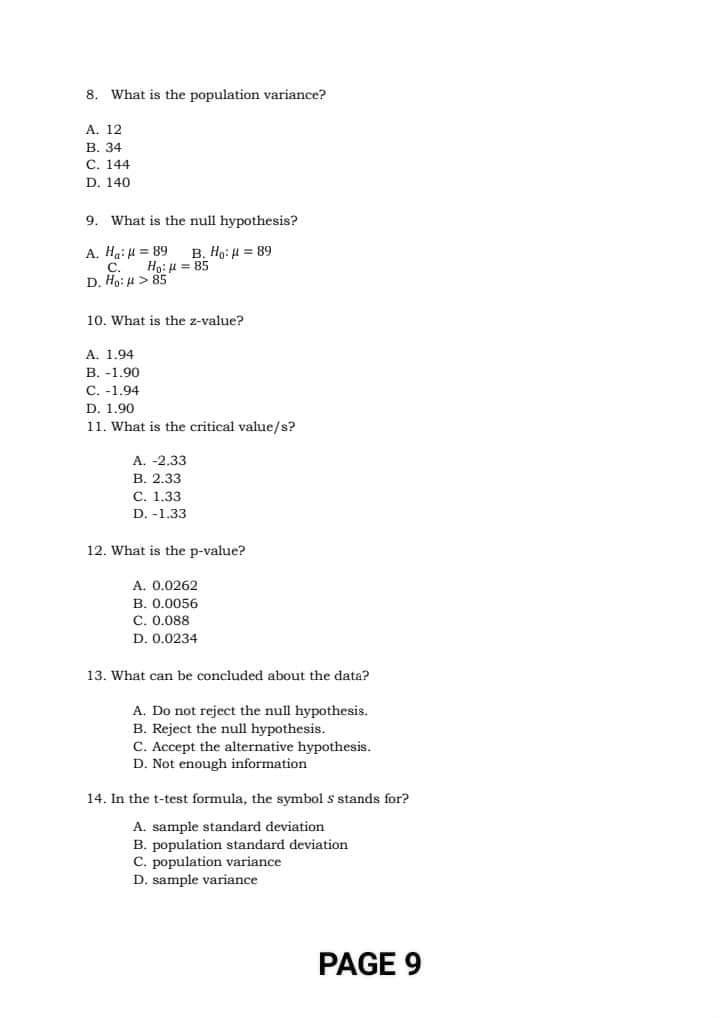
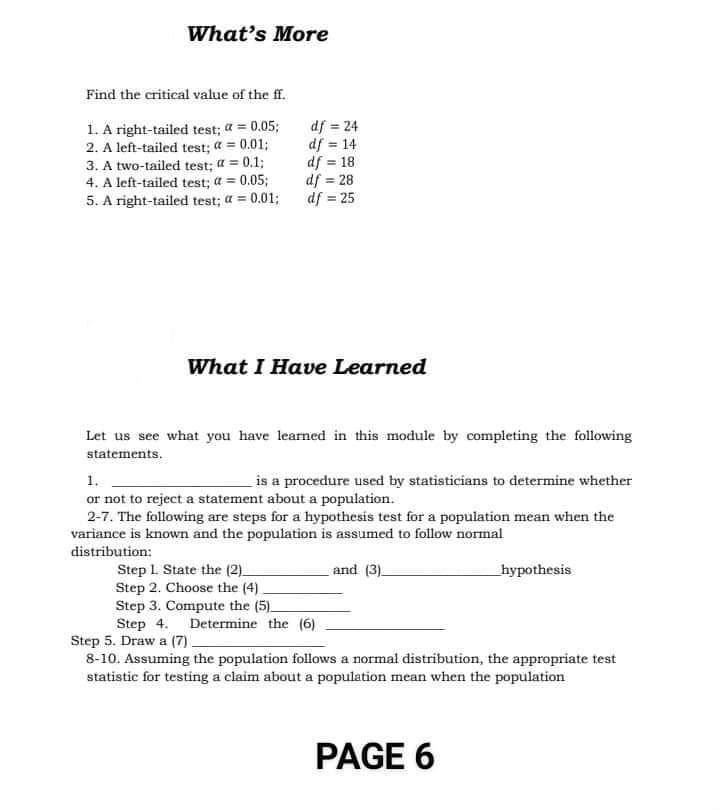
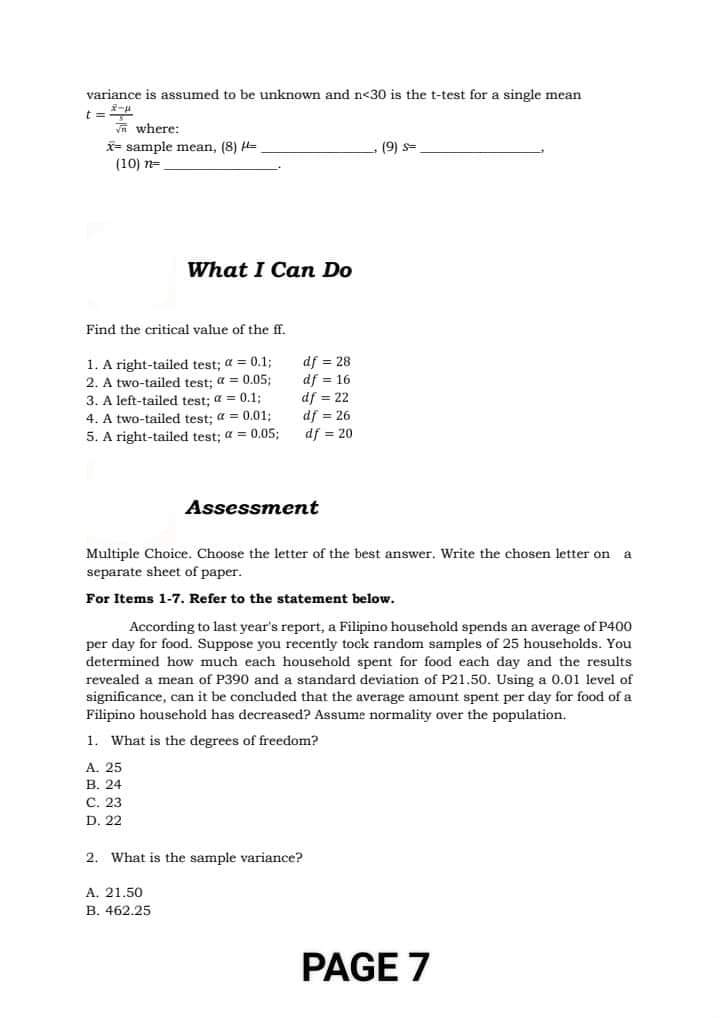
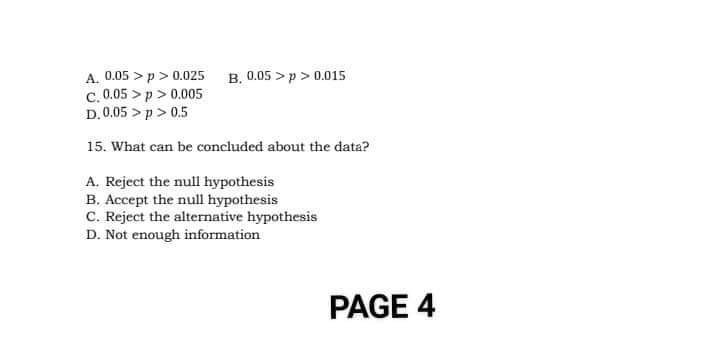
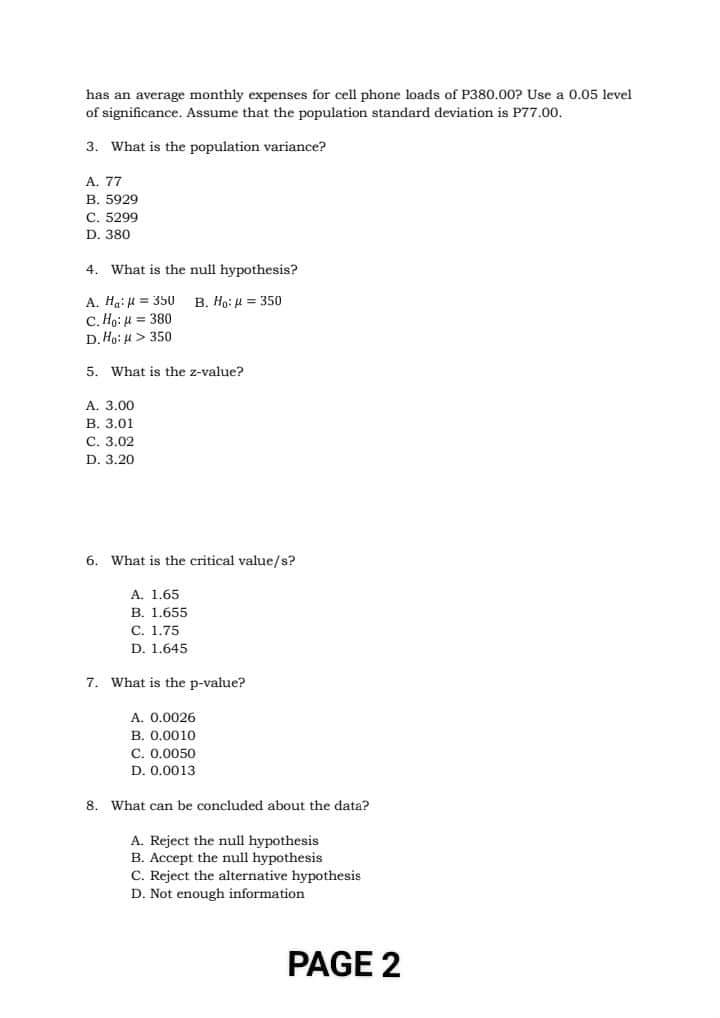
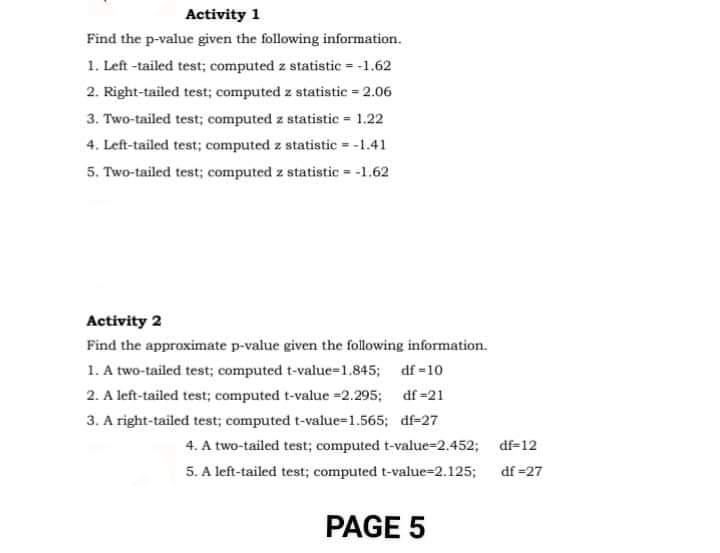
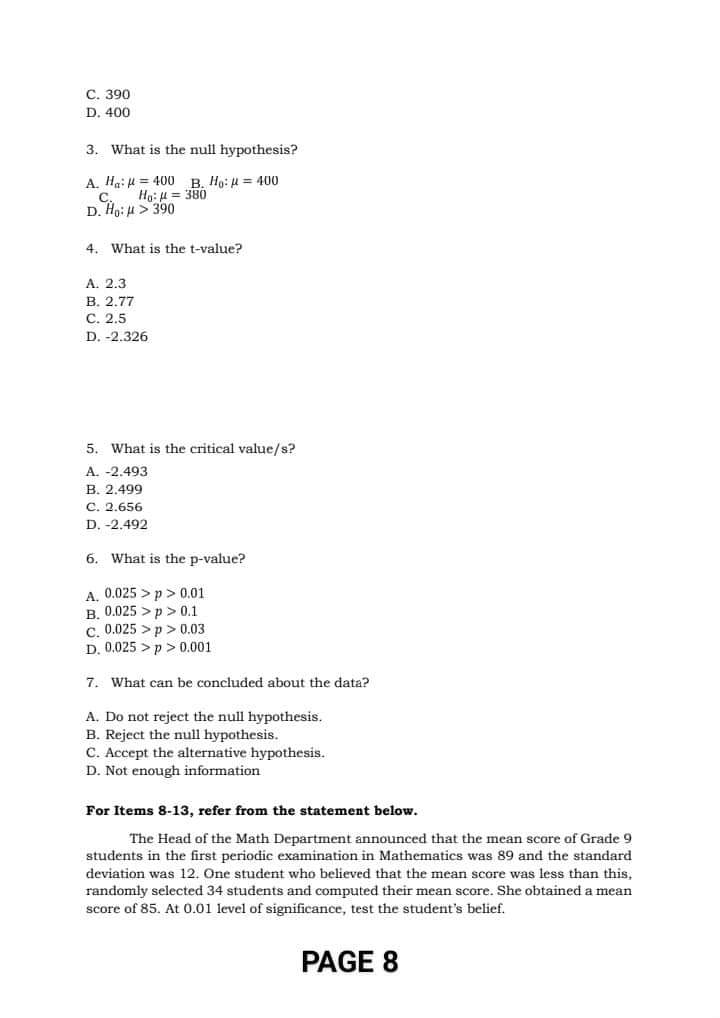
A. 0.05 > p > 0.025 B, 0.05 > p > 0.015 C. 0.05 > p > 0.005 D. 0.05 > p > 0.5 15. What can be concluded about the data? A. Reject the null hypothesis B. Accept the null hypothesis C. Reject the alternative hypothesis D. Not enough information PAGE 49. In the z-test formula, the symbol o stands for? A. population variance B. sample size C. sample standard deviation D. population standard deviation For Items 10-15, refer to the statement below. It was announced over the radio that the average price of a kilogram of pork liempo in Metro Manila is P195. However, a sample of 15 prices randomly collected from different markets in Metro Manila showed an average P200 and a standard deviation of P9.50. Using a 0.05 level of significance, is there sufficient evidence to conclude that the average price of pork liempo in Metro Manila is more than P195? Normality is assumed over the population. 10. What is the sample variance? A. 90.2 B. 90.25 C. 195 D. 9.5 11. What is the null hypothesis? Hail = 195 B. Ho: H = 195 C. Ho: # =9.5 D. Hot # > 200 12. What is the t-value? A. 2.00 B. 2.02 C. 2.04 D. 2.06 13. What is the critical value/s? A. 1.76 B. 1.761 C. 1.77 D. 1.75 14. What is the p-value? PAGE 3has an average monthly expenses for cell phone loads of P380.00? Use a 0.05 level of significance. Assume that the population standard deviation is P77.00. 3. What is the population variance? A. 77 B. 5929 C. 5299 D. 380 4. What is the null hypothesis? A. Ha: H = 350 B. Ho: H = 350 C. Ho: # = 380 D. Ho: # > 350 5. What is the z-value? A. 3.00 B. 3.01 C. 3.02 D. 3.20 6. What is the critical value/s? A. 1.65 B. 1.655 C. 1.75 D. 1.645 7. What is the p-value? A. 0.0026 B. 0.0010 C. 0.0050 D. 0.0013 8. What can be concluded about the data? A. Reject the null hypothesis B. Accept the null hypothesis C. Reject the alternative hypothesis D. Not enough information PAGE 2Activity 1 Find the p-value given the following information. 1. Left -tailed test; computed z statistic = -1.62 2. Right-tailed test; computed z statistic = 2.06 3. Two-tailed test; computed z statistic = 1.22 4. Left-tailed test; computed z statistic = -1.41 5. Two-tailed test; computed z statistic = -1.62 Activity 2 Find the approximate p-value given the following information. 1. A two-tailed test; computed t-value=1.845; df =10 2. A left-tailed test; computed t-value =2.295; of=21 3. A right-tailed test; computed t-value=1.565; df=27 4. A two-tailed test; computed t-value=2.452; df=12 5. A left-tailed test; computed t-value=2.125; df =27 PAGE 5Choose the letter of the correct answer. Write the chosen letter on a separate sheet of paper or in your notebook. 1. It is a procedure used by statisticians to determine whether or not to reject a statement about a population. A. Hypothesis B. Hypothesis-testing C. z-test D. t-test 2. What test statistic is appropriate to use in testing a hypothesis about a population mean when the variance is known? A. z-test B. t-test C. F-test D. all of these For Items 3-8. Refer to the statement below. According to a study done last year the average monthly expenses for cell phone loads of high school students in Manila was P350.00. A Statistics student believes that this amount has increased since January of this year. Is there a reason to believe that this amount has really increased if a random sample of 60 students PAGE 18. What is the population variance? A. 12 B. 34 C. 144 D. 140 9. What is the null hypothesis? A. Haill = 89 B. Ho: / = 89 C. Ho: H = 85 D. Ho: # > 85 10. What is the z-value? A. 1.94 B. -1.90 C. -1.94 D. 1.90 1 1. What is the critical value/s? A. -2.33 B. 2.33 C. 1.33 D. -1.33 12. What is the p-value? A. 0.0262 B. 0.0056 C. 0.088 D. 0.0234 13. What can be concluded about the data? A. Do not reject the null hypothesis. B. Reject the null hypothesis. C. Accept the alternative hypothesis. D. Not enough information 14. In the t-test formula, the symbol $ stands for? A. sample standard deviation B. population standard deviation C. population variance D. sample variance PAGE 9What's More Find the critical value of the ff. 1. A right-tailed test; a = 0.05; df = 24 2. A left-tailed test; ( = 0.01; df = 14 3. A two-tailed test; ( = 0.1; df = 18 4. A left-tailed test; a = 0.05; df = 28 5. A right-tailed test; a = 0.01; df = 25 What I Have Learned Let us see what you have learned in this module by completing the following statements. 1. is a procedure used by statisticians to determine whether or not to reject a statement about a population. 2-7. The following are steps for a hypothesis test for a population mean when the variance is known and the population is assumed to follow normal distribution: Step 1. State the (2). and (3) hypothesis Step 2. Choose the (4) Step 3. Compute the (5). Step 4. Determine the (6) Step 5. Draw a (7) 8-10. Assuming the population follows a normal distribution, the appropriate test statistic for testing a claim about a population mean when the population PAGE 6variance is assumed to be unknown and n 390 4. What is the t-value? A. 2.3 B. 2.77 C. 2.5 D. -2.326 5. What is the critical value/s? A. -2.493 B. 2.499 C. 2.656 D. -2.492 6. What is the p-value? A. 0.025 > p > 0.01 B. 0.025 > p > 0.1 C. 0.025 > p > 0.03 D. 0.025 > p > 0.001 7. What can be concluded about the data? A. Do not reject the null hypothesis. B. Reject the null hypothesis. C. Accept the alternative hypothesis. D. Not enough information For Items 8-13, refer from the statement below. The Head of the Math Department announced that the mean score of Grade 9 students in the first periodic examination in Mathematics was 89 and the standard deviation was 12. One student who believed that the mean score was less than this, randomly selected 34 students and computed their mean score. She obtained a mean score of 85. At 0.01 level of significance, test the student's belief. PAGE 8
Step by Step Solution
There are 3 Steps involved in it
Step: 1
Get Instant Access to Expert-Tailored Solutions
See step-by-step solutions with expert insights and AI powered tools for academic success
Step: 2
Step: 3
Ace Your Homework with AI
Get the answers you need in no time with our AI-driven, step-by-step assistance