Answered step by step
Verified Expert Solution
Question
1 Approved Answer
Please do in excel and show cell references/formulas! Problem 12-27 The spreadsheet below has data on Microsoft and the S&P 500 from 1986 to 2006.
Please do in excel and show cell references/formulas!
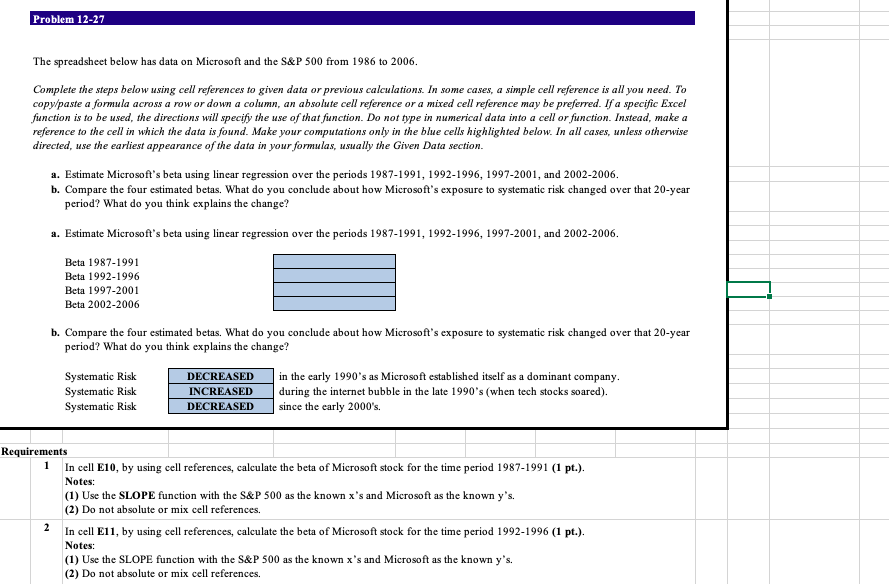
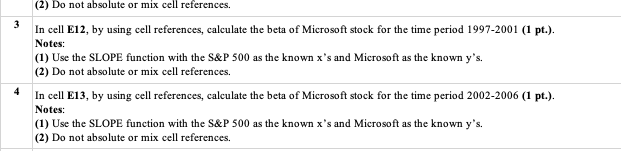
Problem 12-27 The spreadsheet below has data on Microsoft and the S&P 500 from 1986 to 2006. Complete the steps below using cell references to given data or previous calculations. In some cases, a simple cell reference is all you need. To copy/paste a formula across a row or down a column, an absolute cell reference or a mixed cell reference may be preferred. If a specific Excel function is to be used, the directions will specify the use of that function. Do not type in numerical data into a cell or function. Instead, make a reference to the cell in which the data is found. Make your computations only in the blue cells highlighted below. In all cases, unless otherwise directed, use the earliest appearance of the data in your formulas, usually the Given Data section. a. Estimate Microsoft's beta using linear regression over the periods 1987-1991, 1992-1996, 1997-2001, and 2002-2006. b. Compare the four estimated betas. What do you conclude about how Microsoft's exposure to systematic risk changed over that 20-year period? What do you think explains the change? a. Estimate Microsoft's beta using linear regression over the periods 1987-1991, 1992-1996, 1997-2001, and 2002-2006. Beta 1987-1991 Beta 1992-1996 Beta 1997-2001 Beta 2002-2006 b. Compare the four estimated betas. What do you conclude about how Microsoft's exposure to systematic risk changed over that 20-year period? What do you think explains the change? Systematic Risk DECREASED in the early 1990's as Microsoft established itself as a dominant company. Systematic Risk INCREASED during the internet bubble in the late 1990's (when tech stocks soared). Systematic Risk DECREASED since the early 2000's. 1 Requirements In cell E10, by using cell references, calculate the beta of Microsoft stock for the time period 1987-1991 (1 pt.). Notes: (1) Use the SLOPE function with the S&P 500 as the known x's and Microsoft as the known y's. (2) Do not absolute or mix cell references. 2 In cell E11, by using cell references, calculate the beta of Microsoft stock for the time period 1992-1996 (1 pt.). (1) Use the SLOPE function with the S&P 500 as the known x's and Microsoft as the known y's. (2) Do not absolute or mix cell references. Notes: (2) Do not absolute or mix cell references. In cell E12, by using cell references, calculate the beta of Microsoft stock for the time period 1997-2001 (1 pt.). Notes: (1) Use the SLOPE function with the S&P 500 as the known x's and Microsoft as the known y's. (2) Do not absolute or mix cell references. In cell E13, by using cell references, calculate the beta of Microsoft stock for the time period 2002-2006 (1 pt.). Notes: (1) Use the SLOPE function with the S&P 500 as the known x's and Microsoft as the known y's. (2) Do not absolute or mix cell references. Problem 12-27 The spreadsheet below has data on Microsoft and the S&P 500 from 1986 to 2006. Complete the steps below using cell references to given data or previous calculations. In some cases, a simple cell reference is all you need. To copy/paste a formula across a row or down a column, an absolute cell reference or a mixed cell reference may be preferred. If a specific Excel function is to be used, the directions will specify the use of that function. Do not type in numerical data into a cell or function. Instead, make a reference to the cell in which the data is found. Make your computations only in the blue cells highlighted below. In all cases, unless otherwise directed, use the earliest appearance of the data in your formulas, usually the Given Data section. a. Estimate Microsoft's beta using linear regression over the periods 1987-1991, 1992-1996, 1997-2001, and 2002-2006. b. Compare the four estimated betas. What do you conclude about how Microsoft's exposure to systematic risk changed over that 20-year period? What do you think explains the change? a. Estimate Microsoft's beta using linear regression over the periods 1987-1991, 1992-1996, 1997-2001, and 2002-2006. Beta 1987-1991 Beta 1992-1996 Beta 1997-2001 Beta 2002-2006 b. Compare the four estimated betas. What do you conclude about how Microsoft's exposure to systematic risk changed over that 20-year period? What do you think explains the change? Systematic Risk DECREASED in the early 1990's as Microsoft established itself as a dominant company. Systematic Risk INCREASED during the internet bubble in the late 1990's (when tech stocks soared). Systematic Risk DECREASED since the early 2000's. 1 Requirements In cell E10, by using cell references, calculate the beta of Microsoft stock for the time period 1987-1991 (1 pt.). Notes: (1) Use the SLOPE function with the S&P 500 as the known x's and Microsoft as the known y's. (2) Do not absolute or mix cell references. 2 In cell E11, by using cell references, calculate the beta of Microsoft stock for the time period 1992-1996 (1 pt.). (1) Use the SLOPE function with the S&P 500 as the known x's and Microsoft as the known y's. (2) Do not absolute or mix cell references. Notes: (2) Do not absolute or mix cell references. In cell E12, by using cell references, calculate the beta of Microsoft stock for the time period 1997-2001 (1 pt.). Notes: (1) Use the SLOPE function with the S&P 500 as the known x's and Microsoft as the known y's. (2) Do not absolute or mix cell references. In cell E13, by using cell references, calculate the beta of Microsoft stock for the time period 2002-2006 (1 pt.). Notes: (1) Use the SLOPE function with the S&P 500 as the known x's and Microsoft as the known y's. (2) Do not absolute or mix cell referencesStep by Step Solution
There are 3 Steps involved in it
Step: 1

Get Instant Access to Expert-Tailored Solutions
See step-by-step solutions with expert insights and AI powered tools for academic success
Step: 2

Step: 3
Ace Your Homework with AI
Get the answers you need in no time with our AI-driven, step-by-step assistance
Get Started