Question: Please do in Visual Basic The program defined below will be developed over two modules. The goals for this module are to create the GUI

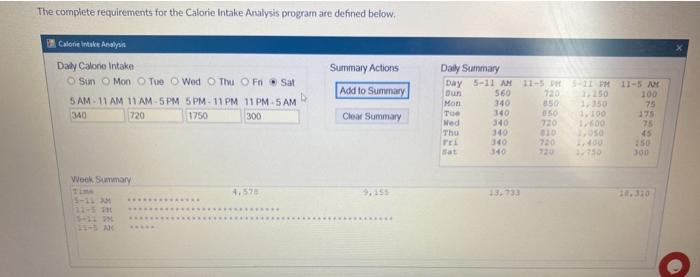

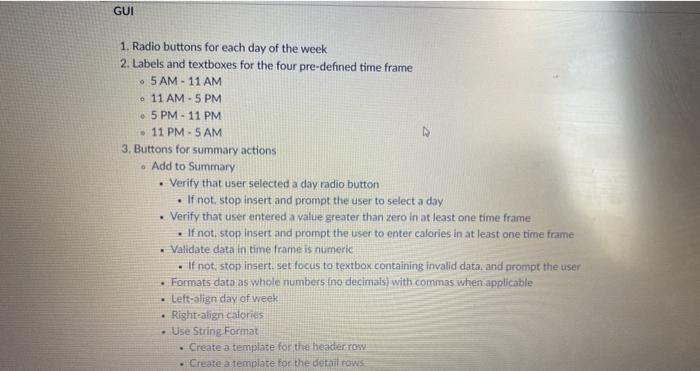
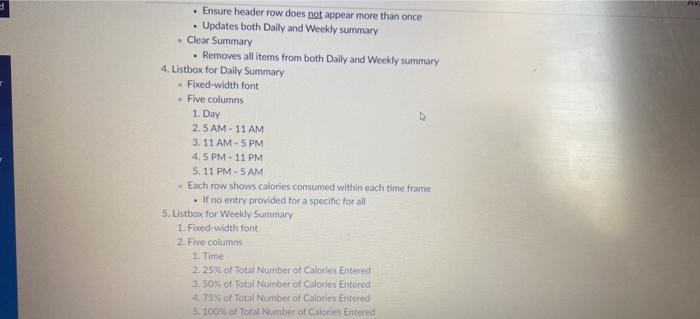


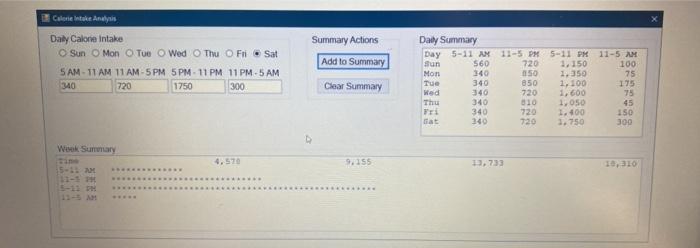
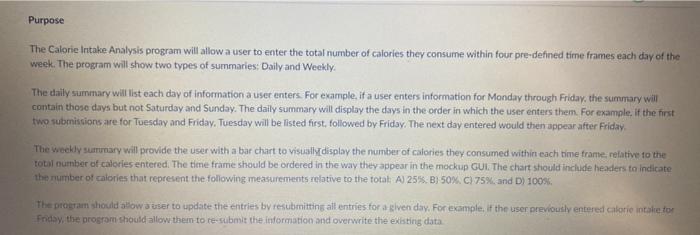
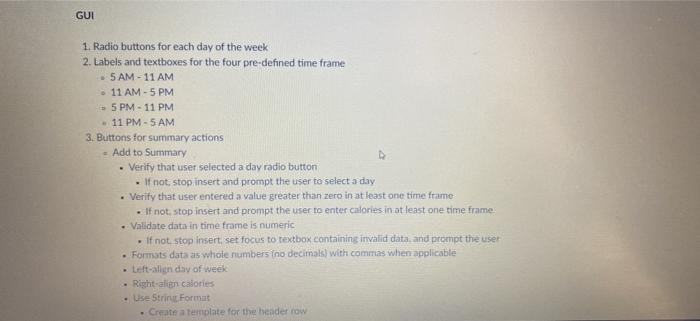
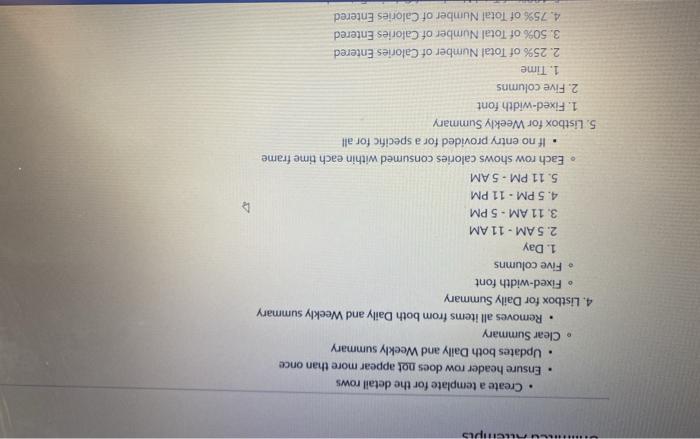
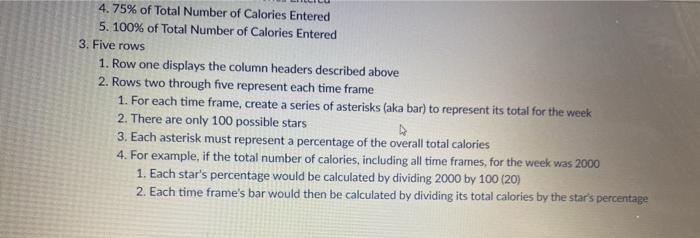

The program defined below will be developed over two modules. The goals for this module are to create the GUI and design documents. The next module will contains ment to complete the source code. For full credit, hita Word document that contains the itemlisted below. 1. Screshot of the completed GUI Data entry was ruled because the program will not be fully functional 2 Herthy hurt showing all procedures and the relationships between them Solowchart that thoroughly describes every aspect of the program The document hold contact enough information that a classmate could use it to completely develop the program any high level programming withouting you for additional direction The complements for the Caloriental Analysis programare defined beow The complete requirements for the Calorie Intake Analysis program are defined below, Calorie intakt Analysis Daly Calone Intake Sun Mon Tue Wed Thu Fri Sat 5 AM 11 AM 11AM-5PM 5PM - 11 PM 11PM-5 AM 340 720 1750 300 Summary Actions Add to Summary Choat Summary Daly Summary Day 5-11 11-5 DSL 11-5 Dun 560 720 100 Mon 340 1.150 75 Tue 340 050 1.100 375 Med 340 730 100 75 Thu 300 31 45 TER 30 720 250 sat 340 1.250 Week Summary 13.733 11-11 AX Purpose The Calorie Intaker Analysis program will allows user to enter the total number of calories they consume within four pre-defined time frames each day of the weel. The program will show two types of summaries: Daily and Weekly They may wil isteach day of information aver til For example, if a ner enters information for Monday through Friday, the summary will contain those days but not Saturday and Sunday. The daily summary will display the days in the order in which the user enters them. For example, if the first two subitoare for Today and Friday, Tuesday wil belated Post followed by Friday. The next day entered would then appear after Friday, The wechlysummary will provide the user with a bar chart to visually display the number of calories they consumed within each time frame, relative to the til number of calories entered. The time frame should be ordered in the way they appear in the mockup GUL The chart should include headers to indicate the number of calories that represent the following measurements relative to the total A) 25% BOX C) 75%, and Dl 100% The bromsboud waiset to date the entries by resubmitting all entries for a given day. For example, if the user previously entered calorie intake for Frid, the rog should ow them to re submit the information and overwrite the existing data GUI 1. Radio buttons for each day of the week 2. Labels and textboxes for the four pre-defined time frame . 5 AM - 11 AM 11 AM - 5 PM 5 PM - 11 PM - 11 PM - 5 AM 3. Buttons for summary actions Add to Summary Verify that user selected a day radio button . If not stop insert and prompt the user to select a day Verify that user entered a value greater than zero in at least one time frame If not stop insert and prompt the user to enter calories in at least one time frame . Validate data in time frame is numeric . If not stop insert set focus to textbox containing invalid data and prompt the user Formats data as whole numbers Ino decimals) with commas when applicable Left-align day of week Right-align calories Use String. Format Create a template for the header row Create a template for the detail rows . Ensure header row does not appear more than once Updates both Daily and Weekly summary Clear Summary Removes all items from both Daily and Weekly summary 4. Listbox for Daily Summary Fixed-width font - Five columns 1. Day 2.5 AM - 11 AM 3. 11 AM - 5 PM 4.5 PM - 11 PM 5. 11 PM - 5 AM Each row shows calories consumed within each time frame . If no entry provided for a specific for all 5. Ustbox for Weekly Summary 1. Fixed-width font 2. Five columns 1 Time 2.25% of Total Number of Calories Entered 3.50% of Total Number of Calories Entered 4.75% of Total Number of Calories Entered 5:100% of Total Number of Calories Entered 3. Five rows 1. Row one displays the column headers described above 2. Rows two through five represent each time frame 1. For each time frame, create a series of asterisks (aka bar) to represent its total for the week 2. There are only 100 possible stars 3. Each asterisk must represent a percentage of the overall total calories 4. For example, if the total number of calories, including all time frames, for the week was 2000 1. Each star's percentage would be calculated bydividing 2000 by 100 (20) 2. Each time frame's bar would then be calculated by dividing its total calories by the star's percentage Details The program defined below will be developed over two modules. The goals for this module ace to create the GUI and design documents. The next module will contain an assement to complete the source code For full credit, submit a Word document that contains the items listed below. 1 Screenshot of the completed GUI - Data entry required because the program will be fully functional 2. Hochy chairt showing all procedures and the relationshlosbetween them 2. Pudocode flowchart that thoroughly describes vespect of the programe The document should contain nou information that come could use it to completely develop the woman high-programm without you for additional direction The count or the control and below. Calenta Analysis Daly Calon Intake Sun Mon Tue Wed Thu Fri Sat Summary Actions Add to Summary 5 AM - 11 AM 11AM-5PM 5PM - 11 PM 11PM-5 AM 340 720 1750 300 Clear Summary Daily Summary Day 5-11 11-5 PM 5-11 PM 11-5 AM Sun 560 720 1.150 100 Mon 140 150 1.350 75 Tue 340 850 1. 100 175 Wed 340 720 1,600 75 Thu 340 810 1050 45 340 720 1.400 150 Gat 720 1.750 300 D Week Summary 4.570 9.155 13,733 1,310 5-11 115 MM Purpose The Calorie Intake Analysis program will allow a user to enter the total number of calories they consume within four pre-defined time frames each day of the week. The program will show two types of summaries: Daily and Weekly The daily summary will list each day of information a user enters. For example, it a user enters information for Monday through Friday, the summary will contain those days but not Saturday and Sunday. The daily summary will display the days in the order in which the user enters them. For example. If the first two submitions are for Tuesday and Friday, Tuesday will be listed first, followed by Friday. The next day entered would then appear after Friday, The weekly suunary will provide the user with a bar chart to visually display the number of calories they consumed within each time frame, relative to the total number of calories entered. The time frame should be ordered in the way they appear in the mockup Gul The chart should include headers to indicate the number of calories that represent the following measurements relative to the total A) 25's. B) 50%. CI 75% and D) 100% The program should allows user to update the entries by resubmitting all entries for a ven day. For example, if the user previously entered calorie intake for Friday, the program should allow them to re-submit the information and overwrite the existing data GUI 1. Radio buttons for each day of the week 2. Labels and textboxes for the four pre-defined time frame 5 AM - 11 AM 11 AM - 5 PM 5 PM - 11 PM 11 PM - 5 AM 3. Buttons for summary actions - Add to Summary Verify that user selected a day radio button . If not stop insert and prompt the user to select a day Verify that user entered a value greater than zero in at least one time frame If not stop insert and prompt the user to enter calories in at least one time frame Validate data in time frame is numeric . If not stop Insert, set focus to textbox containing invalid data and prompt the user Formats data as whole numbers ino decimals) with commas when applicable Left-all day of week Right-align calories Use String Format Create a template for the header row . ... Create a template for the detail rows Ensure header row does not appear more than once Updates both Daily and Weekly summary Clear Summary Removes all items from both Daily and Weekly summary 4. Listbox for Daily Summary Fixed-width font Five columns 1. Day 2.5AM - 11 AM 3. 11 AM - 5 PM 4.5 PM - 11 PM 5.11 PM - 5 AM Each row shows calories consumed within each time frame . If no entry provided for a specific for all 5. Listbox for Weekly Summary 1. Fixed-width font 2. Five columns 1. Time 2.25% of Total Number of Calories Entered 3. 50% of Total Number of Calories Entered 4.75% of Total Number of Calories Entered 4.75% of Total Number of Calories Entered 5. 100% of Total Number of Calories Entered 3. Five rows 1. Row one displays the column headers described above 2. Rows two through five represent each time frame 1. For each time frame, create a series of asterisks (aka bar) to represent its total for the week 2. There are only 100 possible stars 3. Each asterisk must represent a percentage of the overall total calories 4. For example, if the total number of calories, including all time frames, for the week was 2000 1. Each star's percentage would be calculated by dividing 2000 by 100 (20) 2. Each time frame's bar would then be calculated by dividing its total calories by the star's percentage v Details The program defined below will be developed over two modules. The goals for this module are to create the GUI and design documents. The most module wim contain an assignment to complete the source code. For full credit, submit a Word document that contains the items listed below. 1. Screenshot of the completed GUI Data entry is not required because the program will not be fully functional 2. Hierarchy chart showing all procedures and the relationships between them 3. Pseudocode or flowchart that thoroughly describes every aspect of the program The document should contain enough information that a classmate could use it to completely develop the programi in any high-level programming language, without asking you for additional direction. The complete requirements for the Calorie Intake Analysis program are defined below. The program defined below will be developed over two modules. The goals for this module are to create the GUI and design documents. The next module will contains ment to complete the source code. For full credit, hita Word document that contains the itemlisted below. 1. Screshot of the completed GUI Data entry was ruled because the program will not be fully functional 2 Herthy hurt showing all procedures and the relationships between them Solowchart that thoroughly describes every aspect of the program The document hold contact enough information that a classmate could use it to completely develop the program any high level programming withouting you for additional direction The complements for the Caloriental Analysis programare defined beow The complete requirements for the Calorie Intake Analysis program are defined below, Calorie intakt Analysis Daly Calone Intake Sun Mon Tue Wed Thu Fri Sat 5 AM 11 AM 11AM-5PM 5PM - 11 PM 11PM-5 AM 340 720 1750 300 Summary Actions Add to Summary Choat Summary Daly Summary Day 5-11 11-5 DSL 11-5 Dun 560 720 100 Mon 340 1.150 75 Tue 340 050 1.100 375 Med 340 730 100 75 Thu 300 31 45 TER 30 720 250 sat 340 1.250 Week Summary 13.733 11-11 AX Purpose The Calorie Intaker Analysis program will allows user to enter the total number of calories they consume within four pre-defined time frames each day of the weel. The program will show two types of summaries: Daily and Weekly They may wil isteach day of information aver til For example, if a ner enters information for Monday through Friday, the summary will contain those days but not Saturday and Sunday. The daily summary will display the days in the order in which the user enters them. For example, if the first two subitoare for Today and Friday, Tuesday wil belated Post followed by Friday. The next day entered would then appear after Friday, The wechlysummary will provide the user with a bar chart to visually display the number of calories they consumed within each time frame, relative to the til number of calories entered. The time frame should be ordered in the way they appear in the mockup GUL The chart should include headers to indicate the number of calories that represent the following measurements relative to the total A) 25% BOX C) 75%, and Dl 100% The bromsboud waiset to date the entries by resubmitting all entries for a given day. For example, if the user previously entered calorie intake for Frid, the rog should ow them to re submit the information and overwrite the existing data GUI 1. Radio buttons for each day of the week 2. Labels and textboxes for the four pre-defined time frame . 5 AM - 11 AM 11 AM - 5 PM 5 PM - 11 PM - 11 PM - 5 AM 3. Buttons for summary actions Add to Summary Verify that user selected a day radio button . If not stop insert and prompt the user to select a day Verify that user entered a value greater than zero in at least one time frame If not stop insert and prompt the user to enter calories in at least one time frame . Validate data in time frame is numeric . If not stop insert set focus to textbox containing invalid data and prompt the user Formats data as whole numbers Ino decimals) with commas when applicable Left-align day of week Right-align calories Use String. Format Create a template for the header row Create a template for the detail rows . Ensure header row does not appear more than once Updates both Daily and Weekly summary Clear Summary Removes all items from both Daily and Weekly summary 4. Listbox for Daily Summary Fixed-width font - Five columns 1. Day 2.5 AM - 11 AM 3. 11 AM - 5 PM 4.5 PM - 11 PM 5. 11 PM - 5 AM Each row shows calories consumed within each time frame . If no entry provided for a specific for all 5. Ustbox for Weekly Summary 1. Fixed-width font 2. Five columns 1 Time 2.25% of Total Number of Calories Entered 3.50% of Total Number of Calories Entered 4.75% of Total Number of Calories Entered 5:100% of Total Number of Calories Entered 3. Five rows 1. Row one displays the column headers described above 2. Rows two through five represent each time frame 1. For each time frame, create a series of asterisks (aka bar) to represent its total for the week 2. There are only 100 possible stars 3. Each asterisk must represent a percentage of the overall total calories 4. For example, if the total number of calories, including all time frames, for the week was 2000 1. Each star's percentage would be calculated bydividing 2000 by 100 (20) 2. Each time frame's bar would then be calculated by dividing its total calories by the star's percentage Details The program defined below will be developed over two modules. The goals for this module ace to create the GUI and design documents. The next module will contain an assement to complete the source code For full credit, submit a Word document that contains the items listed below. 1 Screenshot of the completed GUI - Data entry required because the program will be fully functional 2. Hochy chairt showing all procedures and the relationshlosbetween them 2. Pudocode flowchart that thoroughly describes vespect of the programe The document should contain nou information that come could use it to completely develop the woman high-programm without you for additional direction The count or the control and below. Calenta Analysis Daly Calon Intake Sun Mon Tue Wed Thu Fri Sat Summary Actions Add to Summary 5 AM - 11 AM 11AM-5PM 5PM - 11 PM 11PM-5 AM 340 720 1750 300 Clear Summary Daily Summary Day 5-11 11-5 PM 5-11 PM 11-5 AM Sun 560 720 1.150 100 Mon 140 150 1.350 75 Tue 340 850 1. 100 175 Wed 340 720 1,600 75 Thu 340 810 1050 45 340 720 1.400 150 Gat 720 1.750 300 D Week Summary 4.570 9.155 13,733 1,310 5-11 115 MM Purpose The Calorie Intake Analysis program will allow a user to enter the total number of calories they consume within four pre-defined time frames each day of the week. The program will show two types of summaries: Daily and Weekly The daily summary will list each day of information a user enters. For example, it a user enters information for Monday through Friday, the summary will contain those days but not Saturday and Sunday. The daily summary will display the days in the order in which the user enters them. For example. If the first two submitions are for Tuesday and Friday, Tuesday will be listed first, followed by Friday. The next day entered would then appear after Friday, The weekly suunary will provide the user with a bar chart to visually display the number of calories they consumed within each time frame, relative to the total number of calories entered. The time frame should be ordered in the way they appear in the mockup Gul The chart should include headers to indicate the number of calories that represent the following measurements relative to the total A) 25's. B) 50%. CI 75% and D) 100% The program should allows user to update the entries by resubmitting all entries for a ven day. For example, if the user previously entered calorie intake for Friday, the program should allow them to re-submit the information and overwrite the existing data GUI 1. Radio buttons for each day of the week 2. Labels and textboxes for the four pre-defined time frame 5 AM - 11 AM 11 AM - 5 PM 5 PM - 11 PM 11 PM - 5 AM 3. Buttons for summary actions - Add to Summary Verify that user selected a day radio button . If not stop insert and prompt the user to select a day Verify that user entered a value greater than zero in at least one time frame If not stop insert and prompt the user to enter calories in at least one time frame Validate data in time frame is numeric . If not stop Insert, set focus to textbox containing invalid data and prompt the user Formats data as whole numbers ino decimals) with commas when applicable Left-all day of week Right-align calories Use String Format Create a template for the header row . ... Create a template for the detail rows Ensure header row does not appear more than once Updates both Daily and Weekly summary Clear Summary Removes all items from both Daily and Weekly summary 4. Listbox for Daily Summary Fixed-width font Five columns 1. Day 2.5AM - 11 AM 3. 11 AM - 5 PM 4.5 PM - 11 PM 5.11 PM - 5 AM Each row shows calories consumed within each time frame . If no entry provided for a specific for all 5. Listbox for Weekly Summary 1. Fixed-width font 2. Five columns 1. Time 2.25% of Total Number of Calories Entered 3. 50% of Total Number of Calories Entered 4.75% of Total Number of Calories Entered 4.75% of Total Number of Calories Entered 5. 100% of Total Number of Calories Entered 3. Five rows 1. Row one displays the column headers described above 2. Rows two through five represent each time frame 1. For each time frame, create a series of asterisks (aka bar) to represent its total for the week 2. There are only 100 possible stars 3. Each asterisk must represent a percentage of the overall total calories 4. For example, if the total number of calories, including all time frames, for the week was 2000 1. Each star's percentage would be calculated by dividing 2000 by 100 (20) 2. Each time frame's bar would then be calculated by dividing its total calories by the star's percentage v Details The program defined below will be developed over two modules. The goals for this module are to create the GUI and design documents. The most module wim contain an assignment to complete the source code. For full credit, submit a Word document that contains the items listed below. 1. Screenshot of the completed GUI Data entry is not required because the program will not be fully functional 2. Hierarchy chart showing all procedures and the relationships between them 3. Pseudocode or flowchart that thoroughly describes every aspect of the program The document should contain enough information that a classmate could use it to completely develop the programi in any high-level programming language, without asking you for additional direction. The complete requirements for the Calorie Intake Analysis program are defined below
Step by Step Solution
There are 3 Steps involved in it

Get step-by-step solutions from verified subject matter experts


