

Answered step by step
Verified Expert Solution
Question
1 Approved Answer
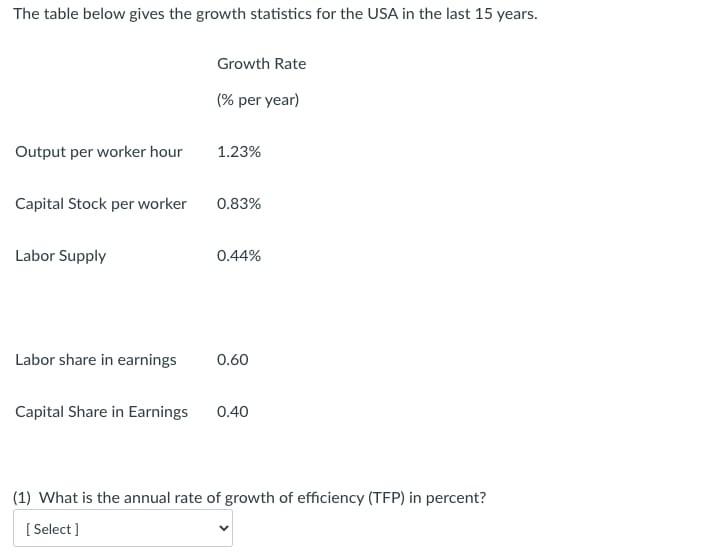
please do it in 10 minutes will upvote The table below gives the growth statistics for the USA in the last 15 years. Growth Rate
please do it in 10 minutes will upvote
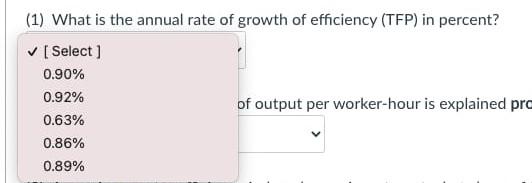
The table below gives the growth statistics for the USA in the last 15 years. Growth Rate (% per year) Output per worker hour 1.23% Capital Stock per worker 0.83% Labor Supply 0.44% Labor share in earnings 0.60 Capital Share in Earnings 0.40 (1) What is the annual rate of growth of efficiency (TFP) in percent? Select] (1) What is the annual rate of growth of efficiency (TFP) in percent? Select) 0.90% 0.92% of output per worker-hour is explained pro 0.63% 0.86% 0.89%Step by Step Solution
There are 3 Steps involved in it
Step: 1

Get Instant Access to Expert-Tailored Solutions
See step-by-step solutions with expert insights and AI powered tools for academic success
Step: 2

Step: 3
Ace Your Homework with AI
Get the answers you need in no time with our AI-driven, step-by-step assistance
Get Started
Audit Of EPAs Fiscal 2013 And 2012 Consolidated Financial Statements
Authors: U.S. Environmental Protection Agency
1st Edition
1500696218, 978-1500696214