 Please do it on excel and show formulas
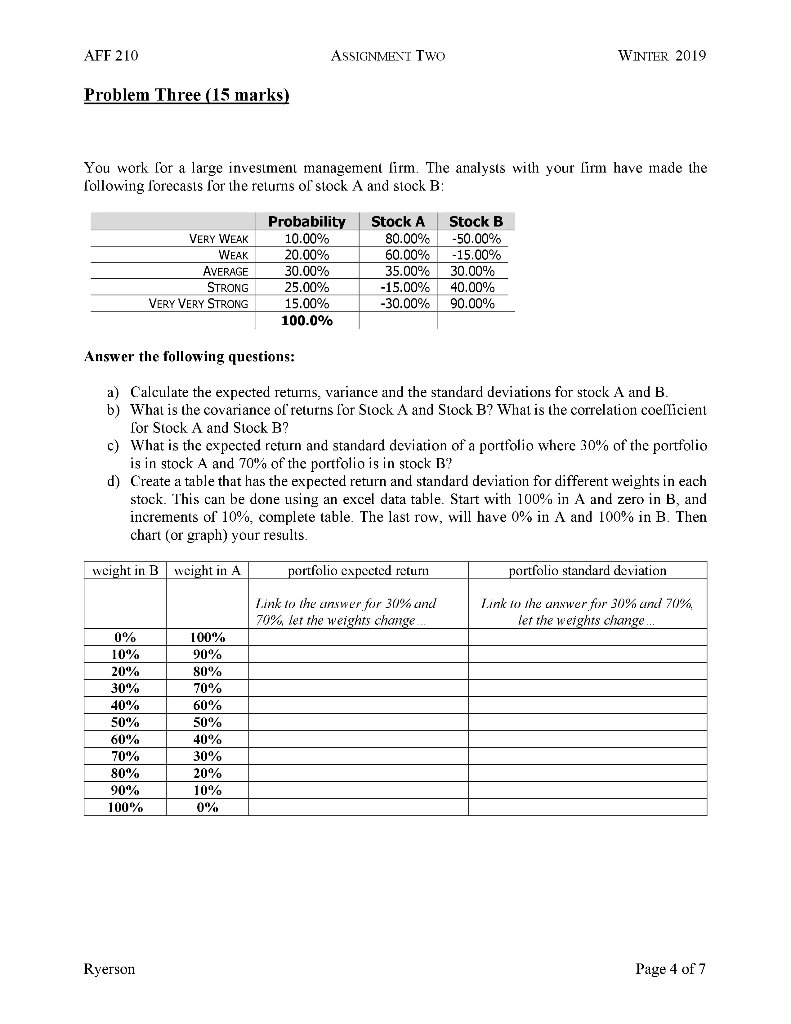
AFF 210 ASSIGNMENT TwoO WINTER 2019 Problem Three (15 marks You work for a large investmeni management lirm. The analysts with your lirm have made the following lorecasts lor the returns of stock A and stock B Probability Stock A Stock B 10.00% VERY WEAK WEAK AVERAGE STRONG VERY VERY STRONG 30.00% 25.00% 15.00% 100.0% 80.009 -50.00% 60.0096| -15.00% 35.00% | 30.00% 15.00% | 40.00% 30.00% 90.00% Answer the following questions: a) Calculate the expected returns, variance and the standard deviations for stock A and B b) What is the covariance of returns for Stock A and Stock B? What is the correlation coelTicient c) What is the expected return and standard deviation of a portfolio where 30% of the portfolio d) Create a table that has the expected return and standard deviation for different weights in each for Stock A and Stock B? is in stock A and 70% of the portfolio is in stock B? stock. This can be done using an excel data table. Start with 100% in A and zero in B, and increments of 10%, complete table. The last row, will have 0% in A and 100% in B. Then chart (or graph) your results wcight in B wcight in A ortfolio cxnectcd return ortfolio standard deviation link to the unswer for 30%, and 70%, let the weights chan 1.mk folle answer for 30% und 70% let the weights chan 0% 10% 20% 30% 40% 50% 60% 70% 80% 90% 100% 100%) 90% 80% 70% 60% 50% 40% 30% 20% 10% 0% Ryerson Page 4 of7 AFF 210 ASSIGNMENT TwoO WINTER 2019 Problem Three (15 marks You work for a large investmeni management lirm. The analysts with your lirm have made the following lorecasts lor the returns of stock A and stock B Probability Stock A Stock B 10.00% VERY WEAK WEAK AVERAGE STRONG VERY VERY STRONG 30.00% 25.00% 15.00% 100.0% 80.009 -50.00% 60.0096| -15.00% 35.00% | 30.00% 15.00% | 40.00% 30.00% 90.00% Answer the following questions: a) Calculate the expected returns, variance and the standard deviations for stock A and B b) What is the covariance of returns for Stock A and Stock B? What is the correlation coelTicient c) What is the expected return and standard deviation of a portfolio where 30% of the portfolio d) Create a table that has the expected return and standard deviation for different weights in each for Stock A and Stock B? is in stock A and 70% of the portfolio is in stock B? stock. This can be done using an excel data table. Start with 100% in A and zero in B, and increments of 10%, complete table. The last row, will have 0% in A and 100% in B. Then chart (or graph) your results wcight in B wcight in A ortfolio cxnectcd return ortfolio standard deviation link to the unswer for 30%, and 70%, let the weights chan 1.mk folle answer for 30% und 70% let the weights chan 0% 10% 20% 30% 40% 50% 60% 70% 80% 90% 100% 100%) 90% 80% 70% 60% 50% 40% 30% 20% 10% 0% Ryerson Page 4 of7