

Answered step by step
Verified Expert Solution
Question
1 Approved Answer
Please do it on excel with formula. will rate you. 1.You have decided to evaluate the following three corporate bonds to include in your portfolio:
Please do it on excel with formula. will rate you. 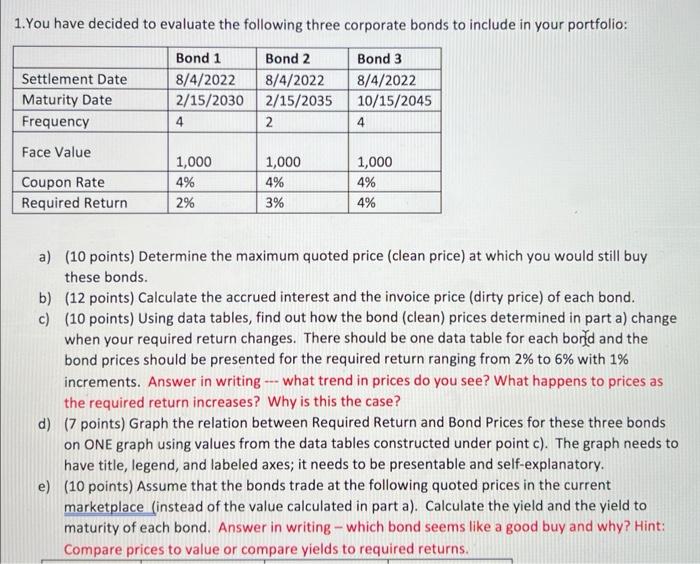
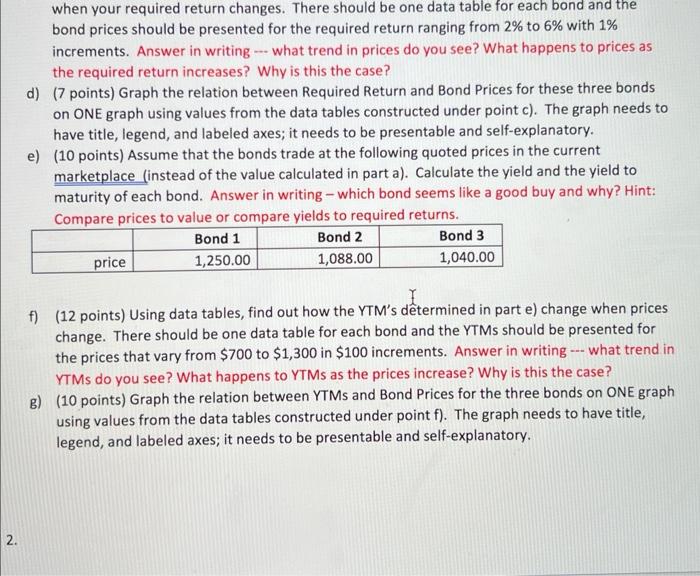
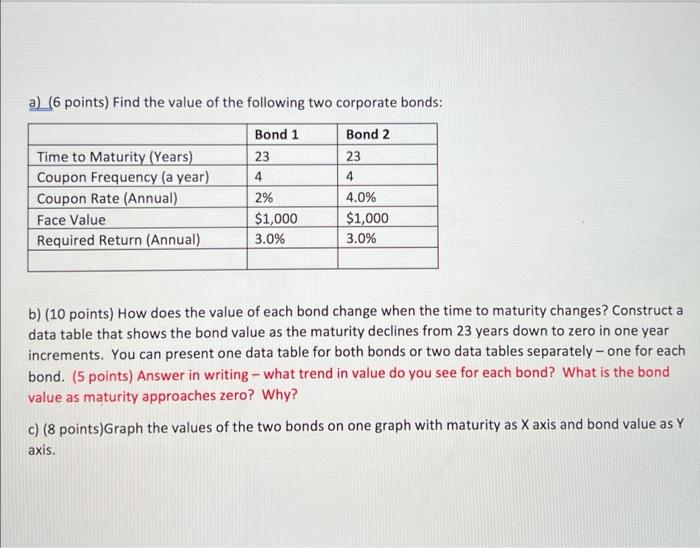
1.You have decided to evaluate the following three corporate bonds to include in your portfolio: a) (10 points) Determine the maximum quoted price (clean price) at which you would still buy these bonds. b) ( 12 points) Calculate the accrued interest and the invoice price (dirty price) of each bond. c) (10 points) Using data tables, find out how the bond (clean) prices determined in part a) change when your required return changes. There should be one data table for each bord and the bond prices should be presented for the required return ranging from 2% to 6% with 1% increments. Answer in writing -. what trend in prices do you see? What happens to prices as the required return increases? Why is this the case? d) (7 points) Graph the relation between Required Return and Bond Prices for these three bonds on ONE graph using values from the data tables constructed under point c). The graph needs to have title, legend, and labeled axes; it needs to be presentable and self-explanatory. e) (10 points) Assume that the bonds trade at the following quoted prices in the current marketplace (instead of the value calculated in part a). Calculate the yield and the yield to maturity of each bond. Answer in writing - which bond seems like a good buy and why? Hint: Compare prices to value or compare yields to required returns. when your required return changes. There should be one data table for each bond and the bond prices should be presented for the required return ranging from 2% to 6% with 1% increments. Answer in writing what trend in prices do you see? What happens to prices as the required return increases? Why is this the case? d) (7 points) Graph the relation between Required Return and Bond Prices for these three bonds on ONE graph using values from the data tables constructed under point c ). The graph needs to have title, legend, and labeled axes; it needs to be presentable and self-explanatory. e) (10 points) Assume that the bonds trade at the following quoted prices in the current marketplace (instead of the value calculated in part a). Calculate the yield and the yield to maturity of each bond. Answer in writing - which bond seems like a good buy and why? Hint: Combare prices to value or compare yields to required returns. f) (12 points) Using data tables, find out how the YTM's dtermined in part e) change when prices change. There should be one data table for each bond and the YTMs should be presented for the prices that vary from $700 to $1,300 in $100 increments. Answer in writing what trend in YTMs do you see? What happens to YTMs as the prices increase? Why is this the case? g) (10 points) Graph the relation between YTMs and Bond Prices for the three bonds on ONE graph using values from the data tables constructed under point f ). The graph needs to have title, legend, and labeled axes; it needs to be presentable and self-explanatory. a) (6 points) Find the value of the following two corporate bonds: b) ( 10 points) How does the value of each bond change when the time to maturity changes? Construct a data table that shows the bond value as the maturity declines from 23 years down to zero in one year increments. You can present one data table for both bonds or two data tables separately-one for each bond. (5 points) Answer in writing - what trend in value do you see for each bond? What is the bond value as maturity approaches zero? Why? c) ( 8 points)Graph the values of the two bonds on one graph with maturity as X axis and bond value as Y axis. 1.You have decided to evaluate the following three corporate bonds to include in your portfolio: a) (10 points) Determine the maximum quoted price (clean price) at which you would still buy these bonds. b) ( 12 points) Calculate the accrued interest and the invoice price (dirty price) of each bond. c) (10 points) Using data tables, find out how the bond (clean) prices determined in part a) change when your required return changes. There should be one data table for each bord and the bond prices should be presented for the required return ranging from 2% to 6% with 1% increments. Answer in writing -. what trend in prices do you see? What happens to prices as the required return increases? Why is this the case? d) (7 points) Graph the relation between Required Return and Bond Prices for these three bonds on ONE graph using values from the data tables constructed under point c). The graph needs to have title, legend, and labeled axes; it needs to be presentable and self-explanatory. e) (10 points) Assume that the bonds trade at the following quoted prices in the current marketplace (instead of the value calculated in part a). Calculate the yield and the yield to maturity of each bond. Answer in writing - which bond seems like a good buy and why? Hint: Compare prices to value or compare yields to required returns. when your required return changes. There should be one data table for each bond and the bond prices should be presented for the required return ranging from 2% to 6% with 1% increments. Answer in writing what trend in prices do you see? What happens to prices as the required return increases? Why is this the case? d) (7 points) Graph the relation between Required Return and Bond Prices for these three bonds on ONE graph using values from the data tables constructed under point c ). The graph needs to have title, legend, and labeled axes; it needs to be presentable and self-explanatory. e) (10 points) Assume that the bonds trade at the following quoted prices in the current marketplace (instead of the value calculated in part a). Calculate the yield and the yield to maturity of each bond. Answer in writing - which bond seems like a good buy and why? Hint: Combare prices to value or compare yields to required returns. f) (12 points) Using data tables, find out how the YTM's dtermined in part e) change when prices change. There should be one data table for each bond and the YTMs should be presented for the prices that vary from $700 to $1,300 in $100 increments. Answer in writing what trend in YTMs do you see? What happens to YTMs as the prices increase? Why is this the case? g) (10 points) Graph the relation between YTMs and Bond Prices for the three bonds on ONE graph using values from the data tables constructed under point f ). The graph needs to have title, legend, and labeled axes; it needs to be presentable and self-explanatory. a) (6 points) Find the value of the following two corporate bonds: b) ( 10 points) How does the value of each bond change when the time to maturity changes? Construct a data table that shows the bond value as the maturity declines from 23 years down to zero in one year increments. You can present one data table for both bonds or two data tables separately-one for each bond. (5 points) Answer in writing - what trend in value do you see for each bond? What is the bond value as maturity approaches zero? Why? c) ( 8 points)Graph the values of the two bonds on one graph with maturity as X axis and bond value as Y axis Step by Step Solution
There are 3 Steps involved in it
Step: 1

Get Instant Access to Expert-Tailored Solutions
See step-by-step solutions with expert insights and AI powered tools for academic success
Step: 2

Step: 3
Ace Your Homework with AI
Get the answers you need in no time with our AI-driven, step-by-step assistance
Get Started
The Oxford Handbook Of Private Equity
Authors: Douglas Cumming
1st Edition
0195391586, 978-0195391589