please do NOT round up the intermediate calculations and use the value factors from the table. thank you.
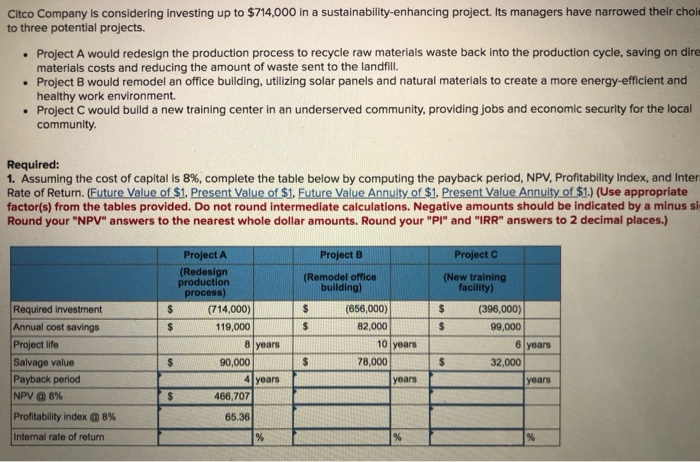
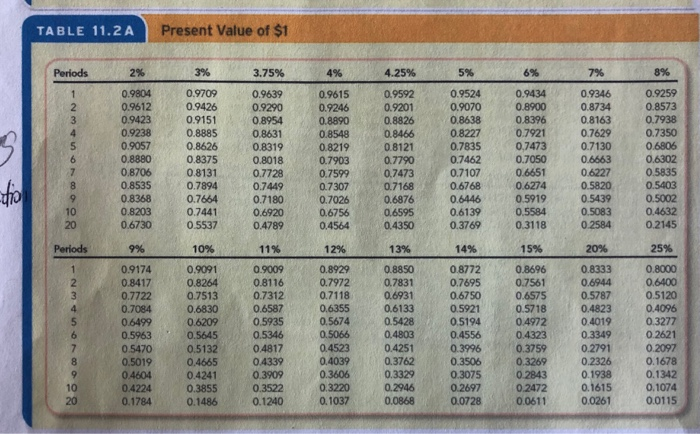
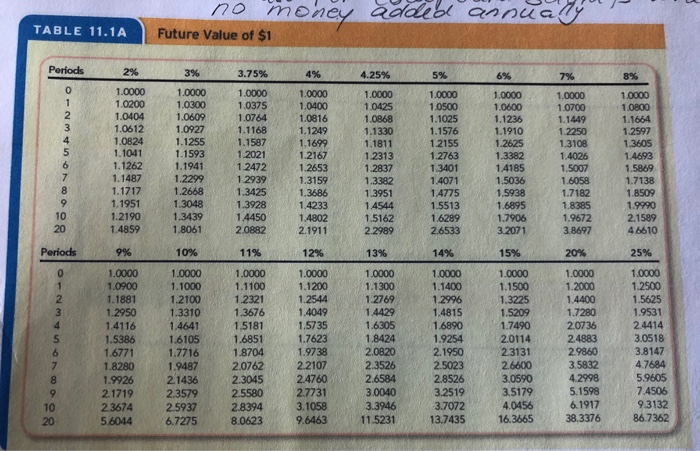
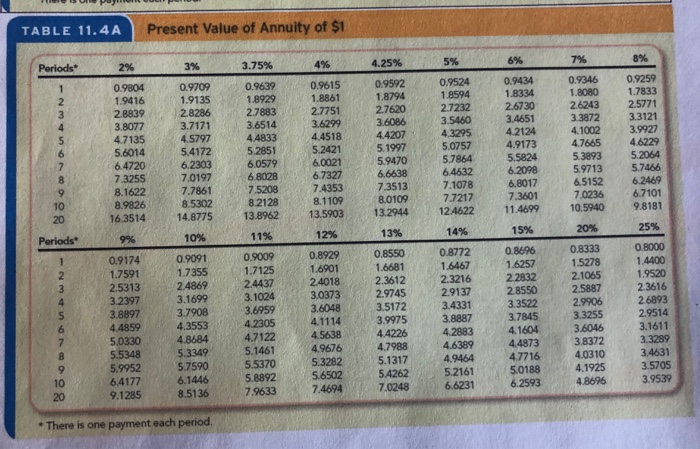
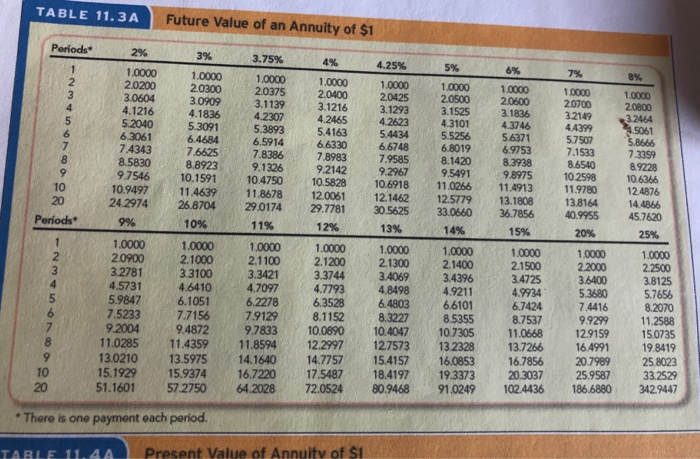
Citco Company is considering investing up to $714,000 in a sustainability-enhancing project. Its managers have narrowed their choi to three potential projects. . Project A would redesign the production process to recycle raw materials waste back into the production cycle, saving on dire materials costs and reducing the amount of waste sent to the landfill. Project B would remodel an office building, utilizing solar panels and natural materials to create a more energy-efficient and healthy work environment. . Project C would build a new training center in an underserved community, providing jobs and economic security for the local community Required: 1. Assuming the cost of capital is 8%, complete the table below by computing the payback period, NPV, Profitability Index, and Inter Rate of Return. (Future Value of $1. Present Value of $1. Future Value Annuity of $1. Present Value Annuity of $1.) (Use appropriate factor(s) from the tables provided. Do not round intermediate calculations. Negative amounts should be indicated by a minus si Round your "NPV" answers to the nearest whole dollar amounts. Round your "Pl" and "IRR" answers to 2 decimal places.) Project B Project C Project A (Redesign production process) (714,000) (Remodel office building) (New training facility) $ (396,000) $ 99,000 $ $ $ $ Required investment Annual cost savings Project life Salvage value Payback period NPV @ 8% Profitability index @ 8% (656,000) 82,000 10 years 78,000 years 119,000 8 years 90,000 4 years 466,707 6 years 32,000 $ $ $ years $ 65.36 Internal rate of return % % % TABLE 11.2 A Present Value of $1 Periods 2% 3% 3.75% 4% 4.25% 5% 6% 7% 8% 1 2 3 4 5 6 7 8 9 10 20 0.9804 0.9612 0.9423 0.9238 0.9057 0.8880 0.8706 0.8535 0.8368 0.8203 0.6730 0.9709 0.9426 0.9151 0.8885 0.8626 0.8375 0.8131 0.7894 0.7664 0.7441 0.5537 0.9639 0.9290 0.8954 0.8631 0.8319 0.8018 0.7728 0.7449 0.7180 0.6920 0.4789 0.9615 0.9246 0.8890 0.8548 0.8219 0.7903 0.7599 0.7307 0.7026 0.6756 0.4564 0.9592 0.9201 0.8826 0.8466 0.8121 0.7790 0.7473 0.7168 0.6876 0.6595 0.4350 0.9524 0.9070 0.8638 0.8227 0.7835 0.7462 0.7107 0.6768 0.6446 0.6139 0.3769 0.9434 0.8900 0.8396 0.7921 0.7473 0.7050 0.6651 0.6274 0.5919 0.5584 0.3118 0.9346 0.8734 0.8163 0.7629 0.7130 0.6663 0.6227 0.5820 0.5439 0.5083 0.2584 0.9259 0.8573 0.7938 0.7350 0.6806 0.6302 0.5835 0.5403 0.5002 0.4632 0.2145 from Periods 9% 10% 11% 12% 13% 14% 15% 20% 25% 1 2 3 4 5 6 7 8 9 10 20 0.9174 0.8417 0.7722 0.7084 0.6499 0.5963 0.5470 0.5019 0.4604 0.4224 0.1784 0.9091 0.8264 0.7513 0.6830 0.6209 0.5645 0.5132 0.4665 0.4241 0.3855 0.1486 0.9009 0.8116 0.7312 0.6587 0.5935 0.5346 0.4817 0.4339 0.3909 0.3522 0.1240 0.8929 0.7972 0.7118 0.6355 0.5674 0.5066 0.4523 0.4039 0.3606 0.3220 0.1037 0.8850 0.7831 0.6931 0.6133 0.5428 0.4803 0.4251 0.3762 0.3329 0.2946 0.0868 0.8772 0.7695 0.6750 0.5921 0.5194 0.4556 0.3996 0.3506 0.3075 0.2697 0.0728 0.8696 0.7561 0.6575 0.5718 0.4972 0.4323 0.3759 0.3269 0.2843 0.2472 0.0611 0.8333 0.6944 0.5787 0.4823 0.4019 0.3349 0.2791 0.2326 0.1938 0.1615 0.0261 0.8000 0.6400 0.5120 0.4096 0.3277 0.2621 0.2097 0.1678 0.1342 0.1074 0.0115 no money added annually TABLE 11.1A Future Value of $1 Periods 2% 3% 3.75% 4% 4.25% 5% 6% 7% 8% 0 1 2 3 4 5 1.0000 1.0200 1.0404 1.0612 1.0824 1.1041 1.1262 1.1487 1.1717 1. 1951 1.2190 1.4859 1.0000 1.0300 1.0609 1.0927 1.1255 1.1593 1.1941 1.2299 1.2668 1.3048 1.3439 1.8061 1.0000 1.0375 1.0764 1.1168 1.1587 1.2021 1.2472 1.2939 1.3425 1.3928 1.4450 2.0882 1.0000 1.0400 1.0816 1.1249 1.1699 1.2167 1.2653 1.3159 1.3686 1.4233 1.4802 2.1911 1.0000 1.0425 1.0868 1.1330 1.1811 1.2313 1.2837 1.3382 1.3951 1.4544 1.5162 2.2989 1.0000 1.0500 1.1025 1.1576 1 2155 1.2763 1.3401 1.4071 1.4775 1.5513 1.6289 2.6533 1.0000 1.0600 1.1236 1.1910 1.2625 1.3382 14185 1.5036 1.5938 1.6895 1.7906 3.2071 1.0000 1.0700 1.1449 1.2250 1.3108 1.4026 1.5007 1.6058 1.7182 1.8385 1.9672 3.8697 1.0000 10800 1.1664 1.2597 1.3605 1.4693 1.5869 1.7138 1.8509 1.9990 2.1589 46610 8 9 10 20 Periods 9% 10% 11% 12% 13% 14% 15% 20% 25% 0 1 2 3 4 5 6 7 8 9 10 20 1.0000 1.0900 1.1881 1.2950 1.4116 1.5386 1.6771 1.8280 1.9926 2.1719 2.3674 5.6044 1.0000 1.1000 1.2100 1.3310 1.4641 1.6105 1.7716 1.9487 2.1436 2.3579 2.5937 6.7275 1.0000 1.1100 1.2321 1.3676 1.5181 1.6851 1.8704 2.0762 2.3045 2.5580 2.8394 8.0623 1.0000 1.1200 1.2544 1.4049 1.5735 1.7623 1.9738 2.2107 2.4760 2.7731 3.1058 9.6463 1.0000 1.1300 1.2769 1.4429 1.6305 1.8424 2.0820 2.3526 2.6584 3.0040 3.3946 11.5231 1.0000 1.1400 1.2996 1.4815 1.6890 1.9254 2.1950 2.5023 2.8526 3.2519 3.7072 13.7435 1.0000 1.1500 1.3225 1.5209 1.7490 2.0114 2.3131 2.6600 3.0590 3.5179 4.0456 16.3665 1.0000 1.2000 1.4400 1.7280 2.0736 2.4883 2.9860 3.5832 4.2998 5.1598 6.1917 38,3376 1.0000 1.2500 1.5625 1.9531 2.4414 3.0518 3.8147 4.7684 5.9605 7.4506 9.3132 86.7362 TABLE 11.4A Present Value of Annuity of $1 5% 6% 7% 4.25% 8% Periods 2% 3% 3.75% 4% 1 2 3 4 0.9804 1.9416 2.8839 3.8077 4.7135 5.6014 6.4720 7.3255 8.1622 8.9826 16.3514 0.9709 1.9135 2.8286 3.7171 4.5797 5.4172 6.2303 7.0197 7.7861 8.5302 14.8775 0.9639 1.8929 2.7883 3.6514 4.4833 5.2851 6.0579 6.8028 7.5208 8.2128 13.8962 0.9615 1.8861 2.7751 3.6299 4.4518 5.2421 6.0021 6.7327 7.4353 8.1109 13.5903 0.9592 1.8794 2.7620 3.6086 4.4207 5.1997 5.9470 6.6638 7.3513 8.0109 13.2944 0.9524 1.8594 2.7232 3.5460 4.3295 5.0757 5.7864 6.4632 7.1078 7.7217 12.4622 6 0.9434 1.8334 2.6730 3.4651 4.2124 4.9173 5.5824 6.2098 6.8017 7.3601 11.4699 0.9346 1.8080 2.6243 3.3872 4.1002 4.7665 5.3893 5.9713 6.5152 7.0236 10.5940 0.9259 1.7833 2.5771 3.3121 3.9927 4.6229 5.2064 5.7466 6.2469 6.7101 9.8181 8 9 10 20 25% 15% 20% 12% 13% 10% 14% Periods 11% 9% 2 3 5 0.9174 1.7591 2.5313 3.2397 3.8897 4.4859 5.0330 5.5348 5.9952 6.4177 9.1285 0.9091 1.7355 2.4869 3.1699 3.7908 4.3553 4.8684 5.3349 5.7590 6.1446 8.5136 0.9009 1.7125 2.4437 3.1024 3.6959 4.2305 4.7122 5.1461 5.5370 5.8892 7.9633 0.8929 1.6901 2.4018 3.0373 3.6048 4.1114 4.5638 4.9676 5.3282 5.6502 7.4694 0.8550 1.6681 2.3612 2.9745 3.5172 3.9975 4.4226 4.7988 5.1317 5.4262 7.0248 0.8772 1.6467 2.3216 2.9137 3.4331 3.8887 4.2883 4.6389 4.9464 5.2161 6.6231 0.8696 1.6257 2.2832 2.8550 3.3522 3.7845 4.1604 4.4873 4.7716 5.0188 6.2593 0.8333 1.5278 2.1065 2.5887 2.9906 3.3255 3.6046 3.8372 4.0310 4.1925 4.8696 0.8000 1.4400 1.9520 23616 26893 2.9514 3.1611 3.3289 3.4631 3.5705 3.9539 8 10 20 * There is one payment each period. TABLE 11.3A Future Value of an Annuity of $1 Periods 2% 3% 3.75% 4% 4.25% 5% 6% 7% 8% 2 3 4 6 1.0000 20200 3.0604 4.1216 5.2040 6.3061 7.4343 8.5830 9.7546 10.9497 24.2974 9% 1.0000 2.0300 3.0909 4.1836 5.3091 6.4684 7.6625 8.8923 10.1591 11.4639 26.8704 10% 1.0000 2.0375 3.1139 4.2307 5.3893 6.5914 7.8386 9.1326 10.4750 11.8678 29.0174 1.0000 2.0400 3.1216 4.2465 5.4163 6.6330 7.8983 9.2142 10.5828 12.0061 29.7781 12% 8 9 10 20 Periods 1.0000 2.0425 3.1293 4.2623 5.4434 6.6748 7.9585 9.2967 10.6918 12.1462 30.5625 13% 1.0000 20500 3.1525 4.3101 5.5256 6.8019 8.1420 9.5491 11.0266 12.5779 33.0660 14% 1.0000 20600 3.1836 4.3746 5.6371 6.9753 8.3938 9.8975 11.4913 13.1808 36.7856 1.0000 20700 32149 4.4399 57507 7.1533 8.6540 102598 11.9780 13.8164 40.9955 20% 1.0000 20800 3.2464 1.5061 5.8666 7.3359 8.9228 10.6366 12.4876 14.4866 45.7620 25% 11% 15% 2 3 4 1.0000 2.0900 3 2781 4.5731 5.9847 7.5233 9.2004 11.0285 13.0210 15.1929 51.1601 1.0000 2.1000 3.3100 4.6410 6.1051 7.7156 9.4872 11.4359 13.5975 15.9374 57.2750 1.0000 2.1100 3.3421 4.7097 6.2278 7.9129 9.7833 11.8594 14.1640 16.7220 64.2028 1.0000 2.1200 3.3744 4.7793 6.3528 8.1152 10.0890 12.2997 14.7757 17.5487 72.0524 1.0000 21300 3.4069 4.8498 6.4803 8.3227 10.4047 12.7573 15.4157 18.4197 80.9468 1.0000 2.1400 3.4396 4.9211 6.6101 8.5355 10.7305 13.2328 16.0853 19.3373 91.0249 1.0000 2.1500 3.4725 4.9934 6.7424 8.7537 11.0668 13.7266 16.7856 20.3037 102.4436 1.0000 2.2000 3.6400 5.3680 7.4416 9.9299 12.9159 16.4991 20.7989 25.9587 186.6880 1.0000 22500 3.8125 5.7656 8.2070 11.2588 15.0735 19.8419 25.8023 33.2529 342.9447 9 10 20 * There is one payment each period. TABLE 11. AA Present Value of Annuity of $1