

Answered step by step
Verified Expert Solution
Question
1 Approved Answer
please do part (d) only. please help . Q1 Download Poverty share less than 30 USD per day.xlsx' file from Google Classroom. This file is
please do part (d) only. please help .
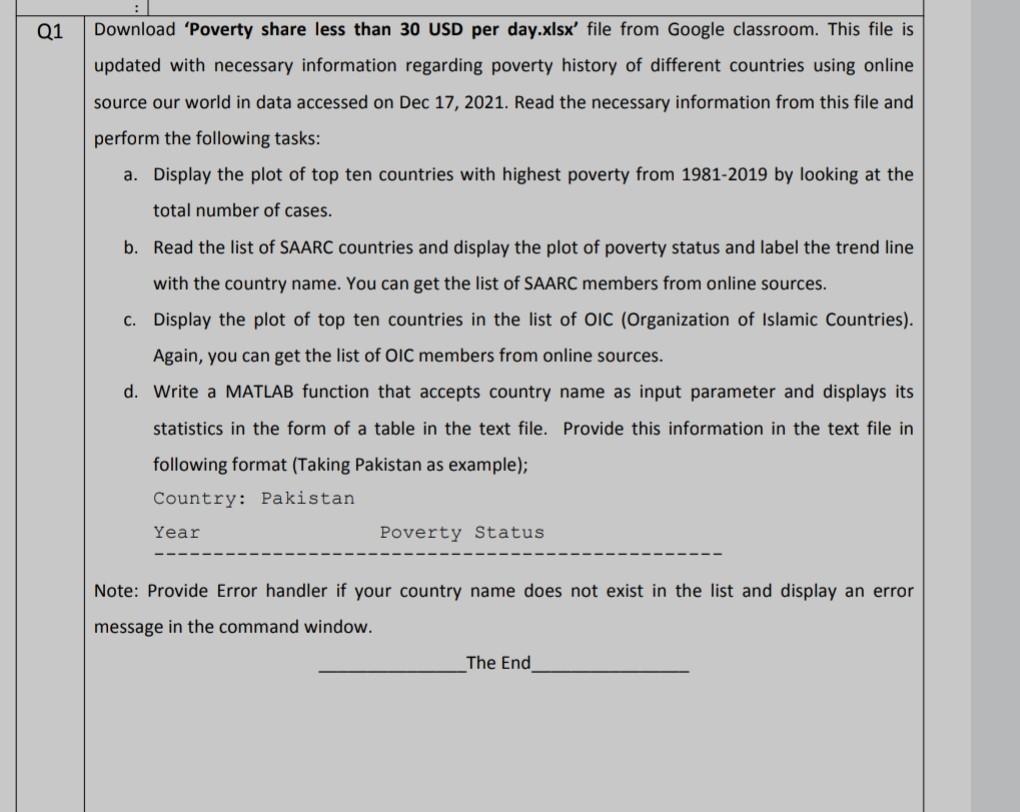
Q1 Download "Poverty share less than 30 USD per day.xlsx' file from Google Classroom. This file is updated with necessary information regarding poverty history of different countries using online source our world in data accessed on Dec 17, 2021. Read the necessary information from this file and perform the following tasks: a. Display the plot of top ten countries with highest poverty from 1981-2019 by looking at the total number of cases. b. Read the list of SAARC countries and display the plot of poverty status and label the trend line with the country name. You can get the list of SAARC members from online sources. c. Display the plot of top ten countries in the list of OIC (Organization of Islamic Countries). Again, you can get the list of OIC members from online sources. d. Write a MATLAB function that accepts country name as input parameter and displays its statistics in the form of a table in the text file. Provide this information in the text file in following format (Taking Pakistan as example); Country: Pakistan Year Poverty Status Note: Provide Error handler if your country name does not exist in the list and display an error message in the command window. The End Q1 Download "Poverty share less than 30 USD per day.xlsx' file from Google Classroom. This file is updated with necessary information regarding poverty history of different countries using online source our world in data accessed on Dec 17, 2021. Read the necessary information from this file and perform the following tasks: a. Display the plot of top ten countries with highest poverty from 1981-2019 by looking at the total number of cases. b. Read the list of SAARC countries and display the plot of poverty status and label the trend line with the country name. You can get the list of SAARC members from online sources. c. Display the plot of top ten countries in the list of OIC (Organization of Islamic Countries). Again, you can get the list of OIC members from online sources. d. Write a MATLAB function that accepts country name as input parameter and displays its statistics in the form of a table in the text file. Provide this information in the text file in following format (Taking Pakistan as example); Country: Pakistan Year Poverty Status Note: Provide Error handler if your country name does not exist in the list and display an error message in the command window. The EndStep by Step Solution
There are 3 Steps involved in it
Step: 1

Get Instant Access to Expert-Tailored Solutions
See step-by-step solutions with expert insights and AI powered tools for academic success
Step: 2

Step: 3
Ace Your Homework with AI
Get the answers you need in no time with our AI-driven, step-by-step assistance
Get Started
Database Security
Authors: Alfred Basta, Melissa Zgola
1st Edition
1435453905, 978-1435453906