Question
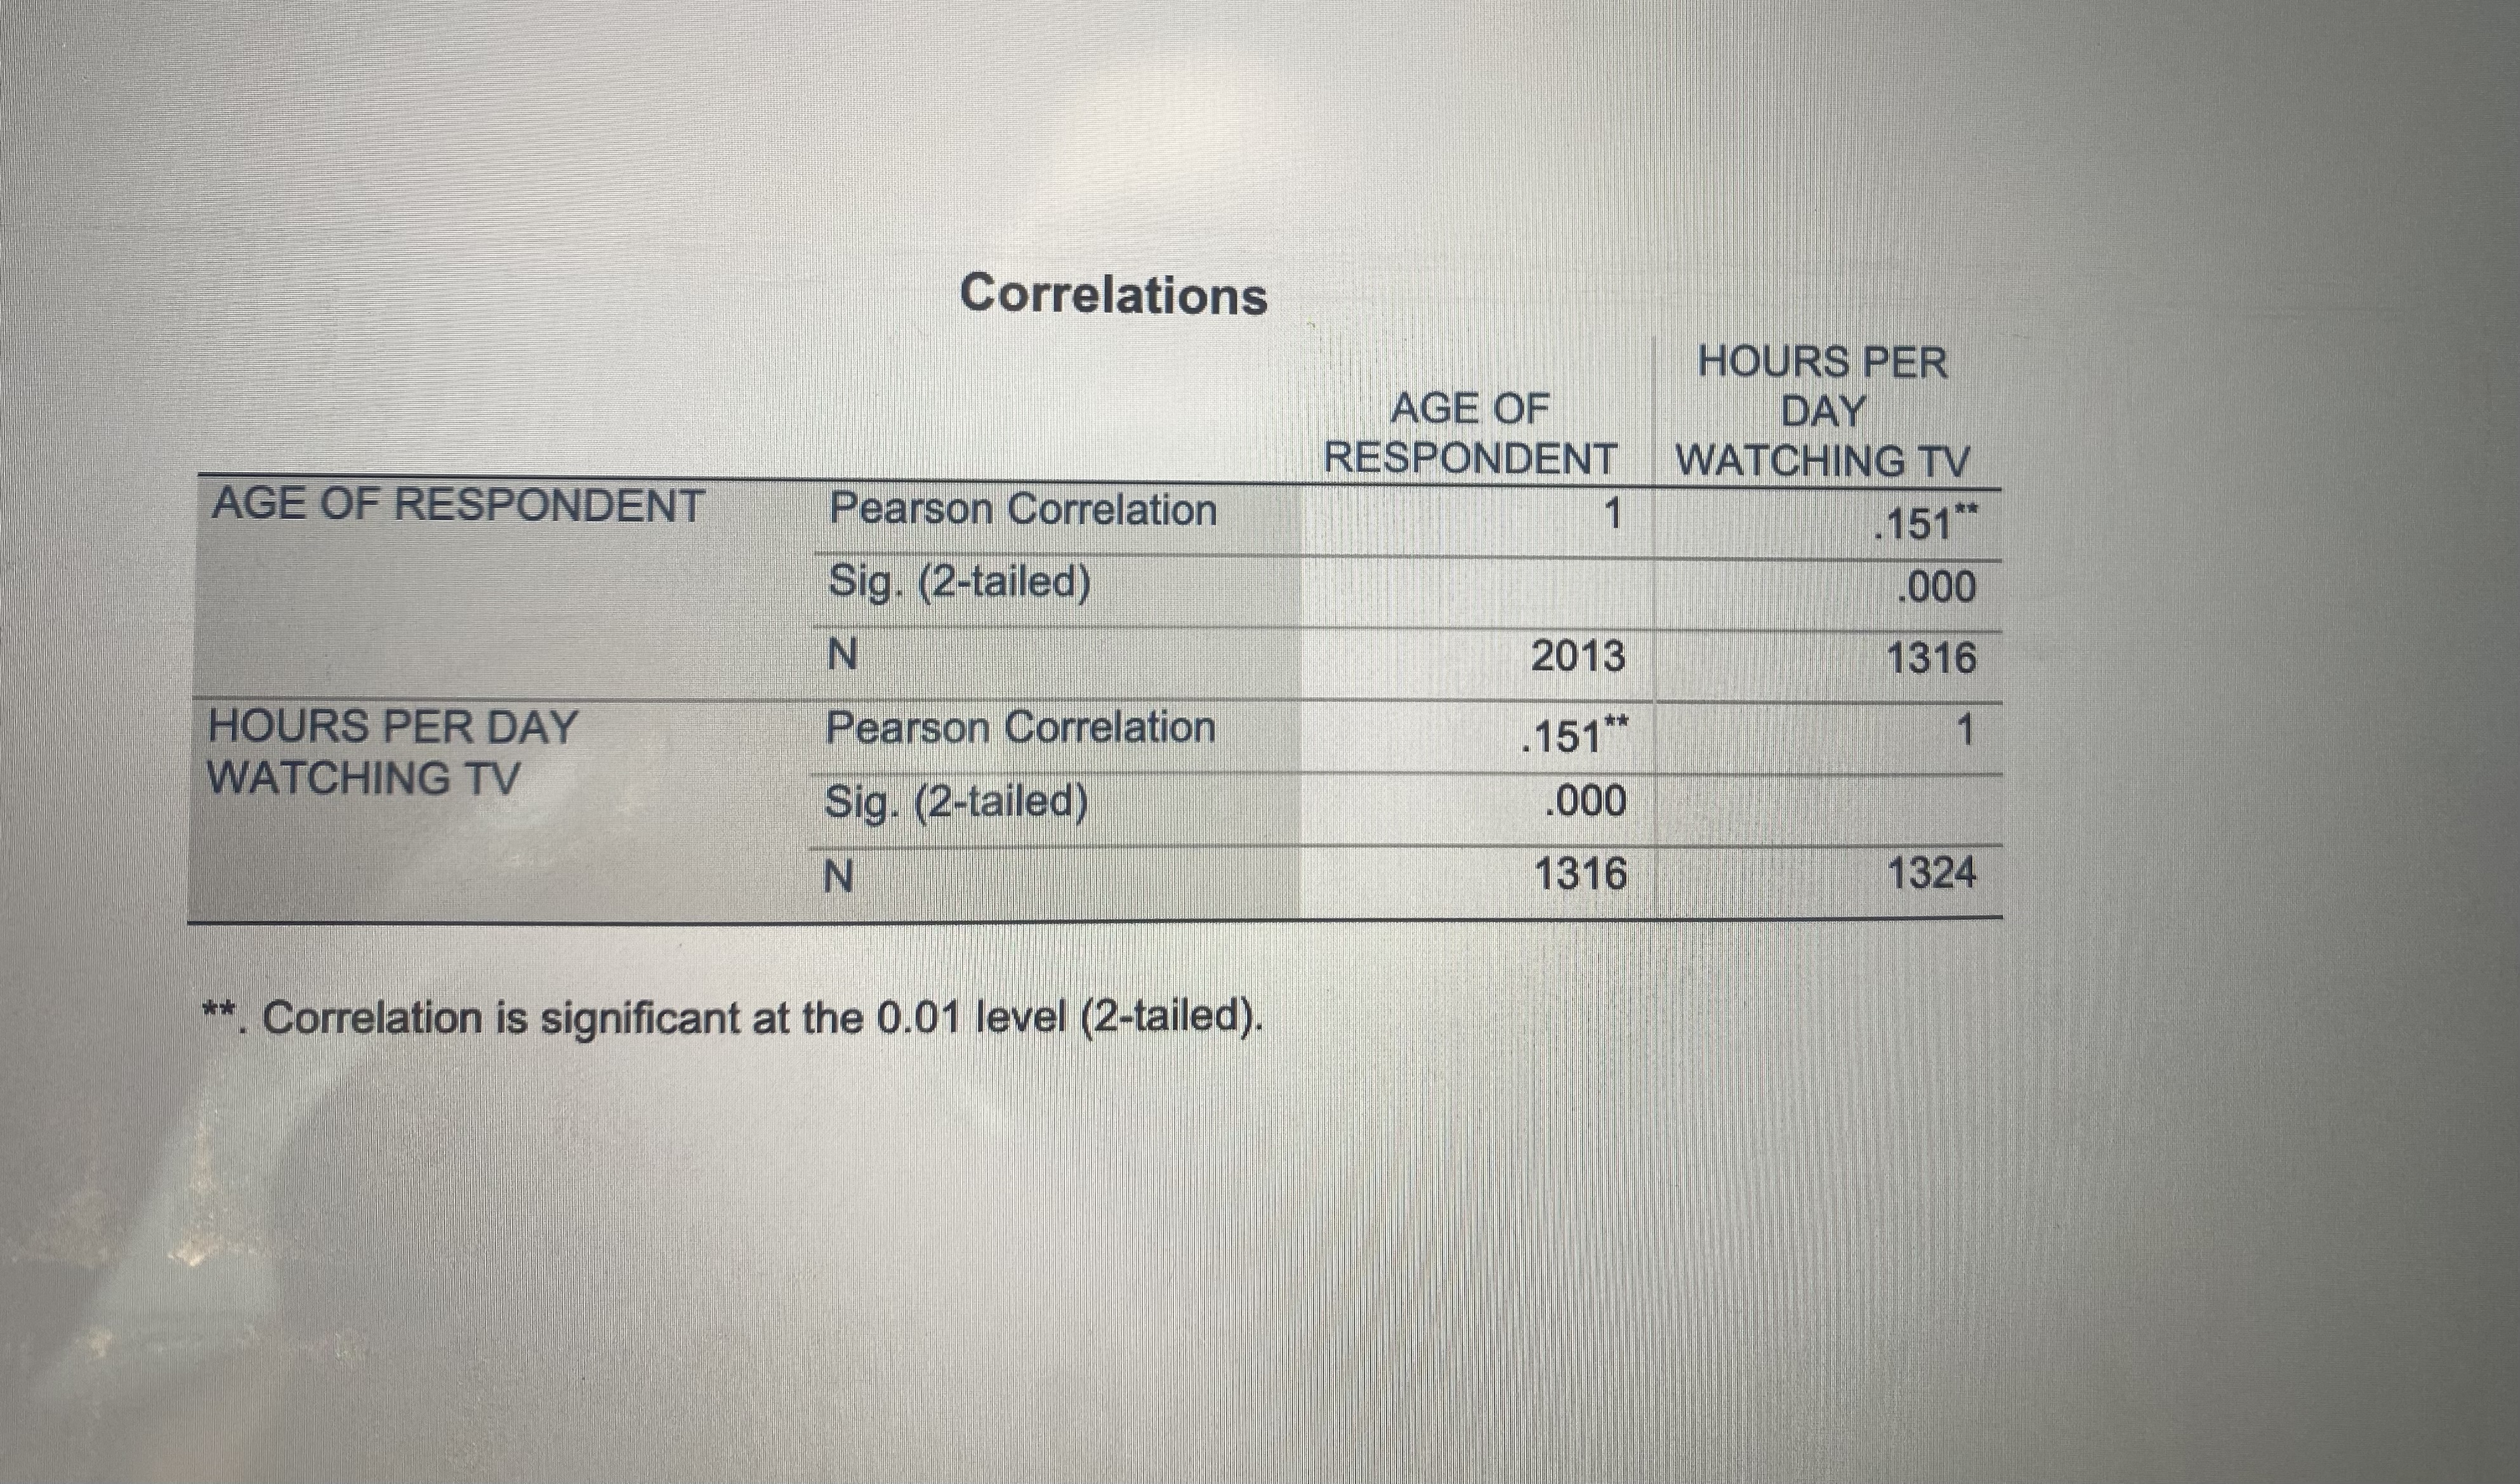
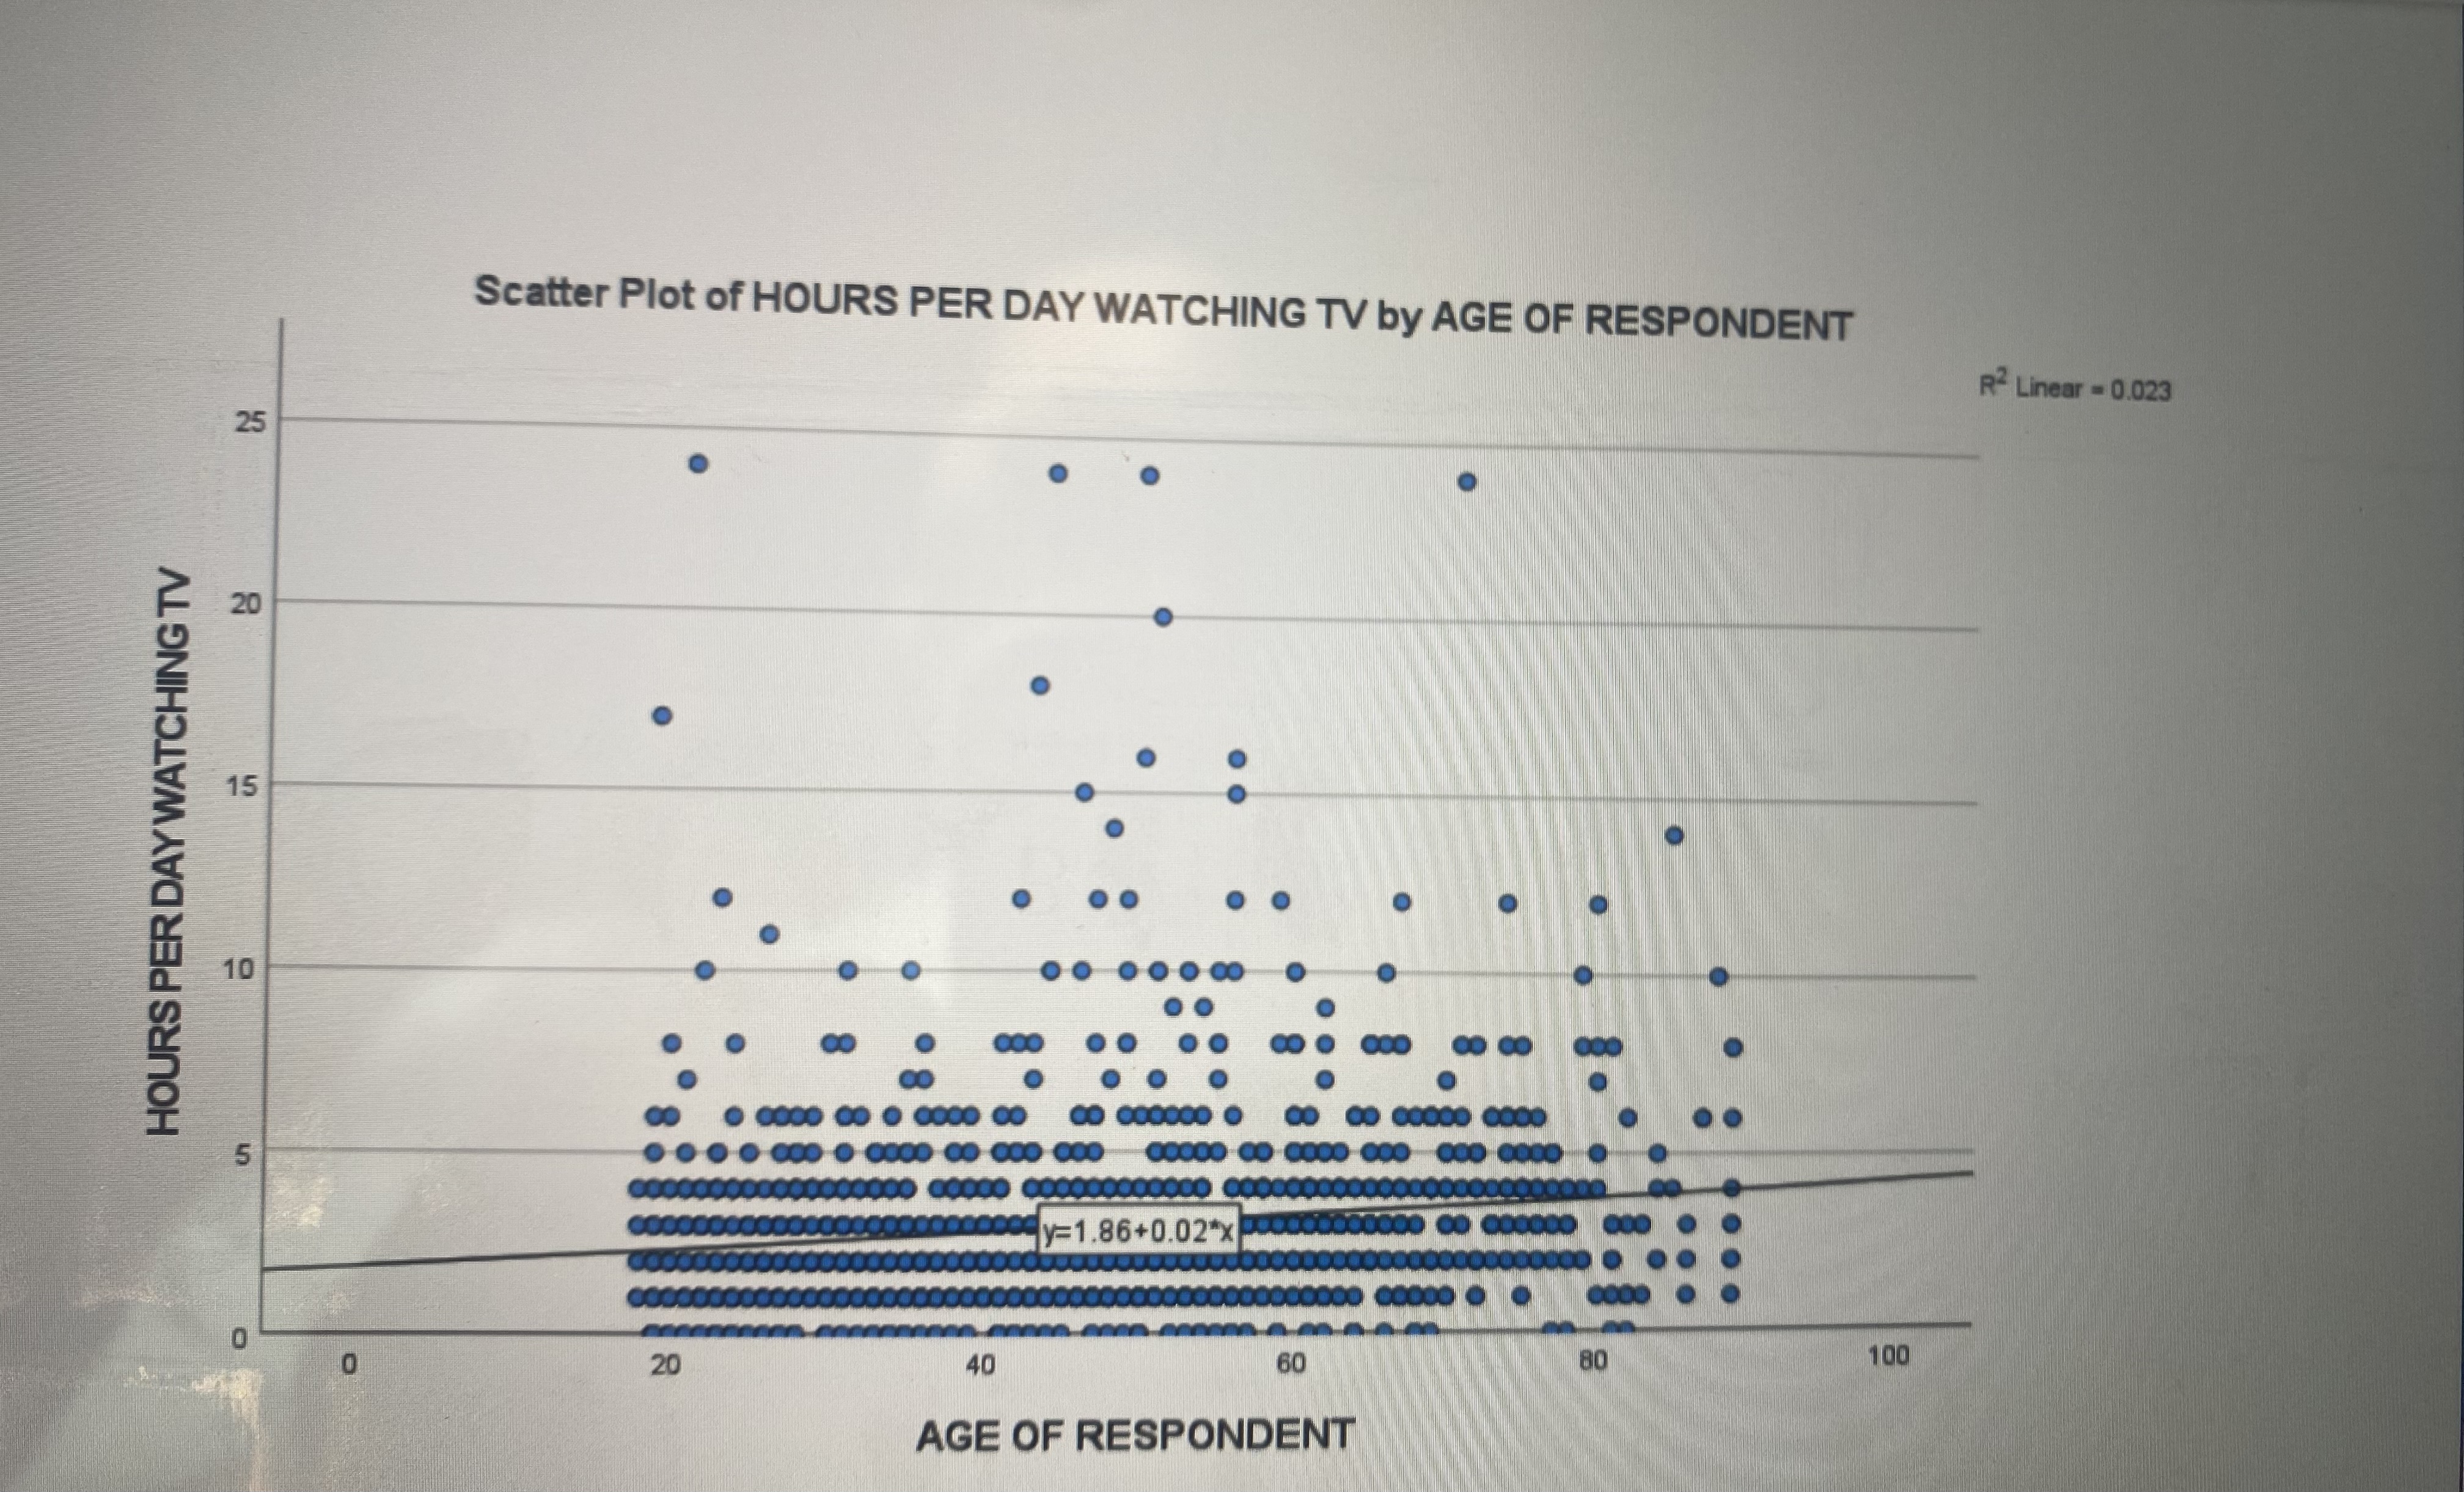
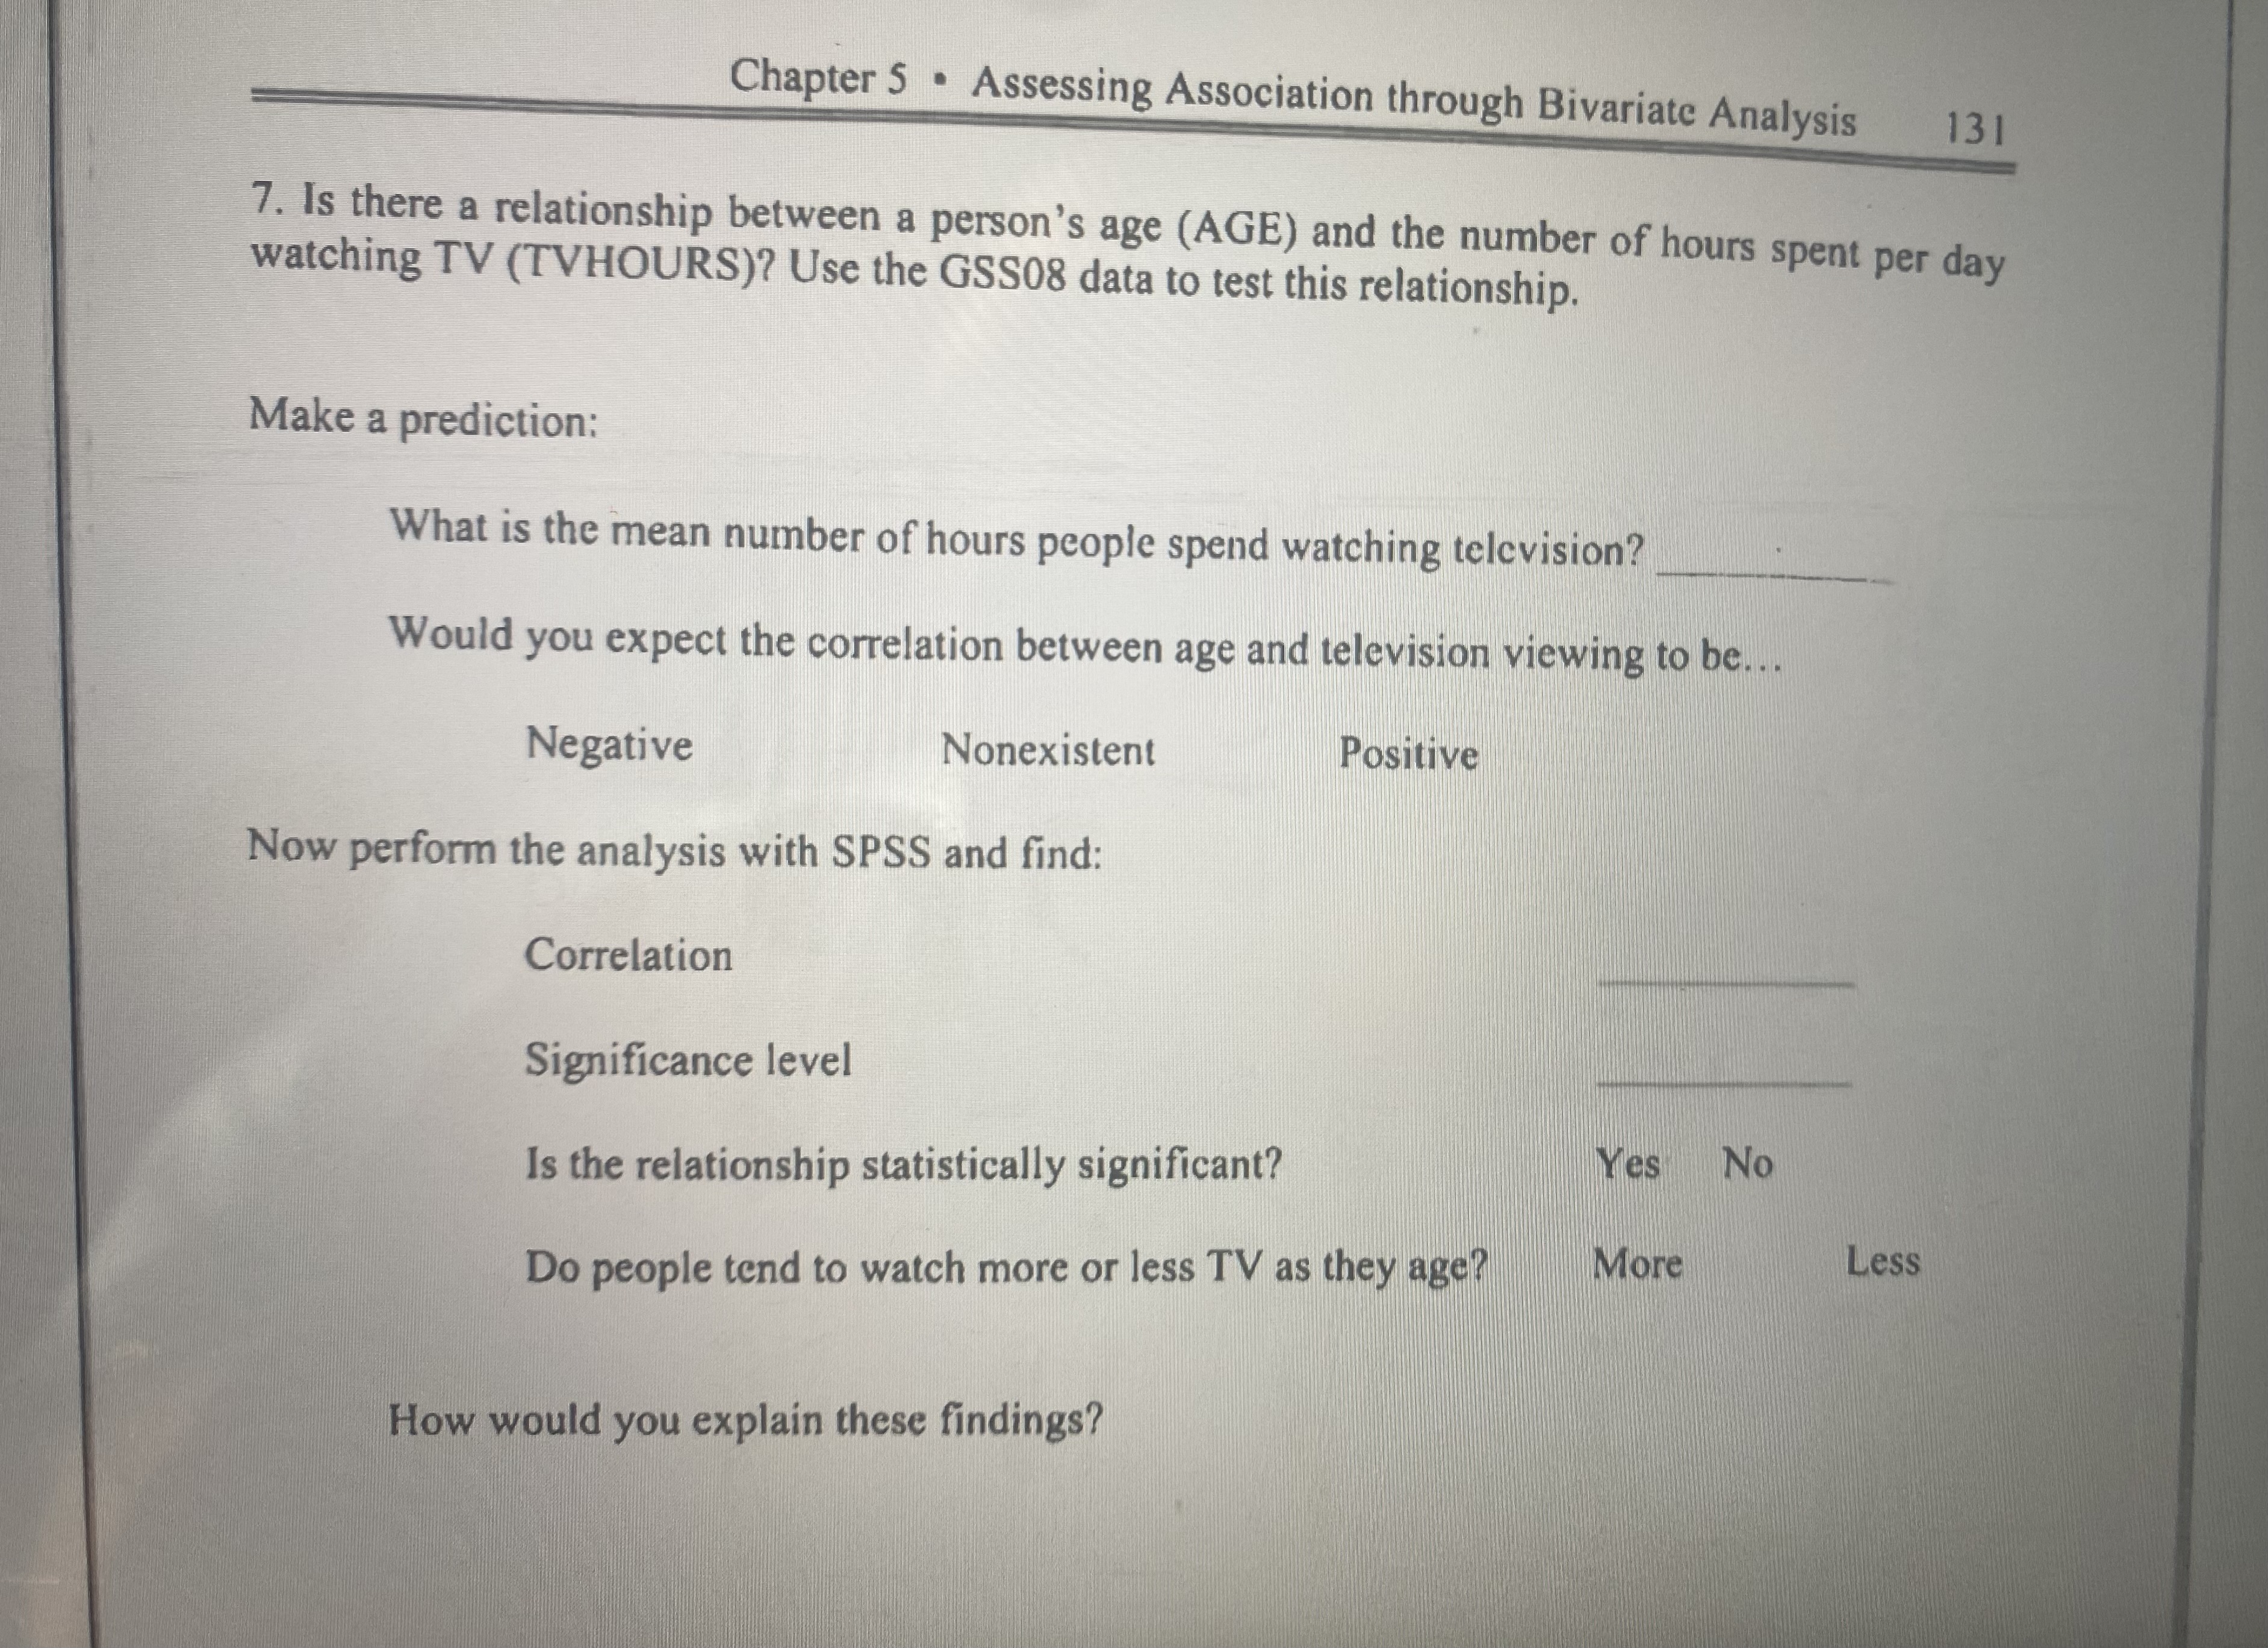
Please do the 5 steps of the hypothesis, which are. Picture and Homework are attached. Analysis was done in 2008 and is for U.S. Adults.
Please do the 5 steps of the hypothesis, which are. Picture and Homework are attached. Analysis was done in 2008 and is for U.S. Adults. Do the 5 steps of the hypothesis, and provide an interpretation from the example
below.
All information is attached!!!
Follow format. Answer all questions besides do not answer the question "How would you explain these findings?".
Instead, do the 5 steps of the hypothesis and provide an interpretation.
Disregard step number 4 as the analysis is already done and attached for reference. However, please provide a table name for the output attached. Ex. Table 1. Median Male Earnings by Percent Graduated from High School,
U.S. States, 2008.
5 steps
?Null Hypothesis- There is no relationship between percent graduated from high
school in a state and median male earnings.
?Nondirectional - There is a relationship between...
?Directional - There is a positive relationship between ...
? Set Alpha = .05 as this is the maximum risk in the social sciences for a Type 1
error
? Select test statistic- signif for Pearson's r (b/c two scale-continuous variables)
? Run test - SPSS output. Disregard as SPSS output is attached to order. However, please provide a table name for the output attached. Ex. Table 1. Median Male Earnings by Percent Graduated from High School,
U.S. States, 2008
?Make decision - reject or fail to reject? Signif or not?
Make sure to please provide interpretation and follow format. Analysis was done in 2008 and is for U.S. Adults, so please start off that way with your interpretation.
Ex. In 2008, there was a statistically significant, yet
weak, positive relationship between percent of the
population in a U.S. state that graduated from high
school and median male earnings, r=.299, n = 51,
p=.03). As the percentage of high school graduates
increases so does median male earnings.
Approximately 8.9% of the variation in median male
earnings across states can be explained by the
differences in high school graduation rates (r2=.089)
How strong is the relationship?
? Compare Pearson coefficient to Table 5.2
? .8 to 1.0 - very strong
? .6 to .8 - strong
? .4 to .6 - moderate
? .2 to .4 - weak
? .0 to .2 - weak or no relationship


Step by Step Solution
There are 3 Steps involved in it
Step: 1

Get Instant Access to Expert-Tailored Solutions
See step-by-step solutions with expert insights and AI powered tools for academic success
Step: 2

Step: 3

Ace Your Homework with AI
Get the answers you need in no time with our AI-driven, step-by-step assistance
Get Started


