

Answered step by step
Verified Expert Solution
Question
1 Approved Answer
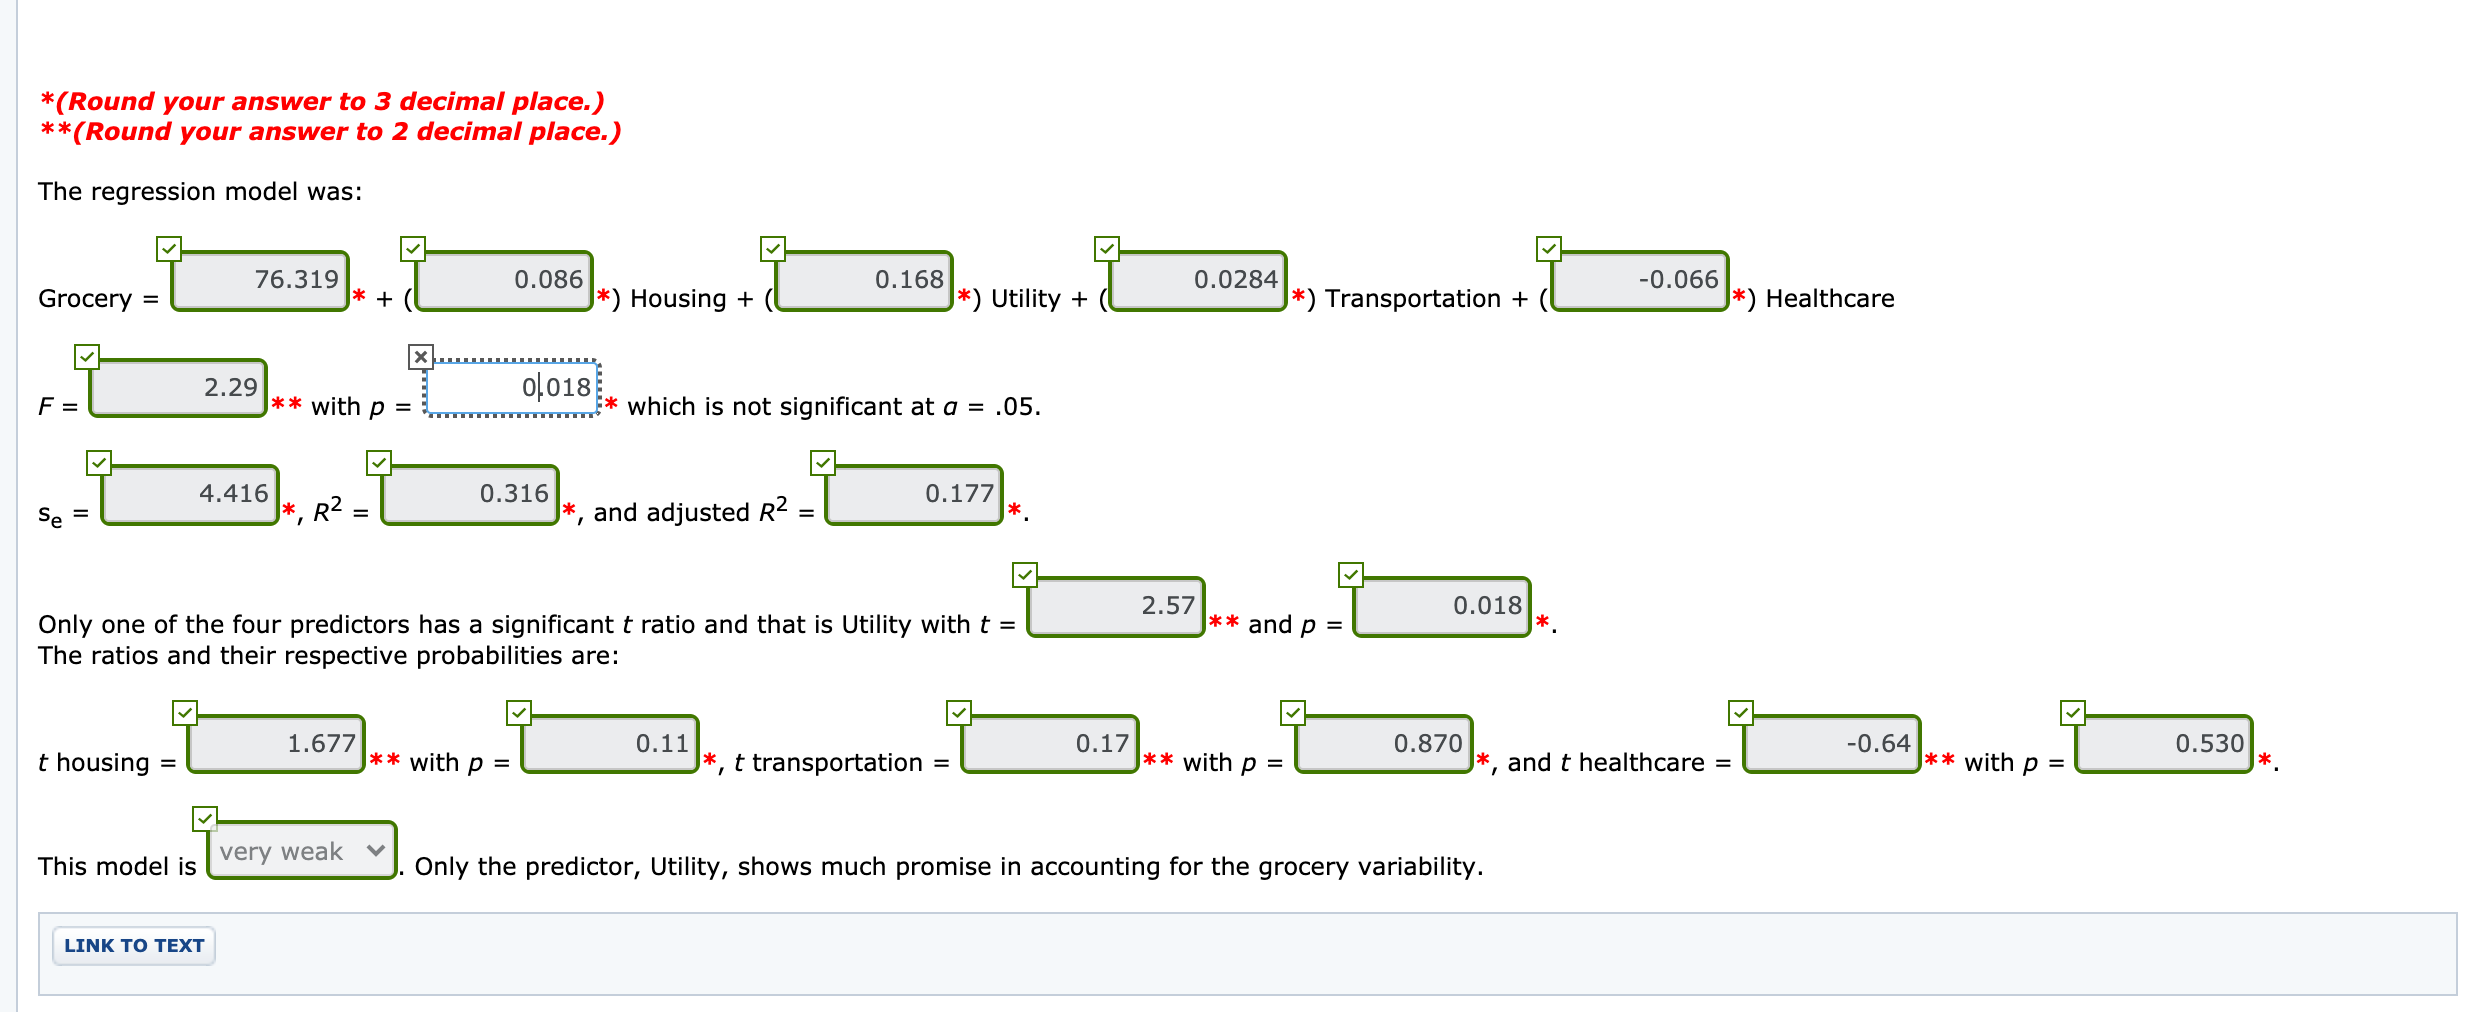
Please do the work on EXCEL and show the process srceenshot The American Chamber of Commerce Researchers Association compiles cost-of-living indexes for selected metropolitan areas.
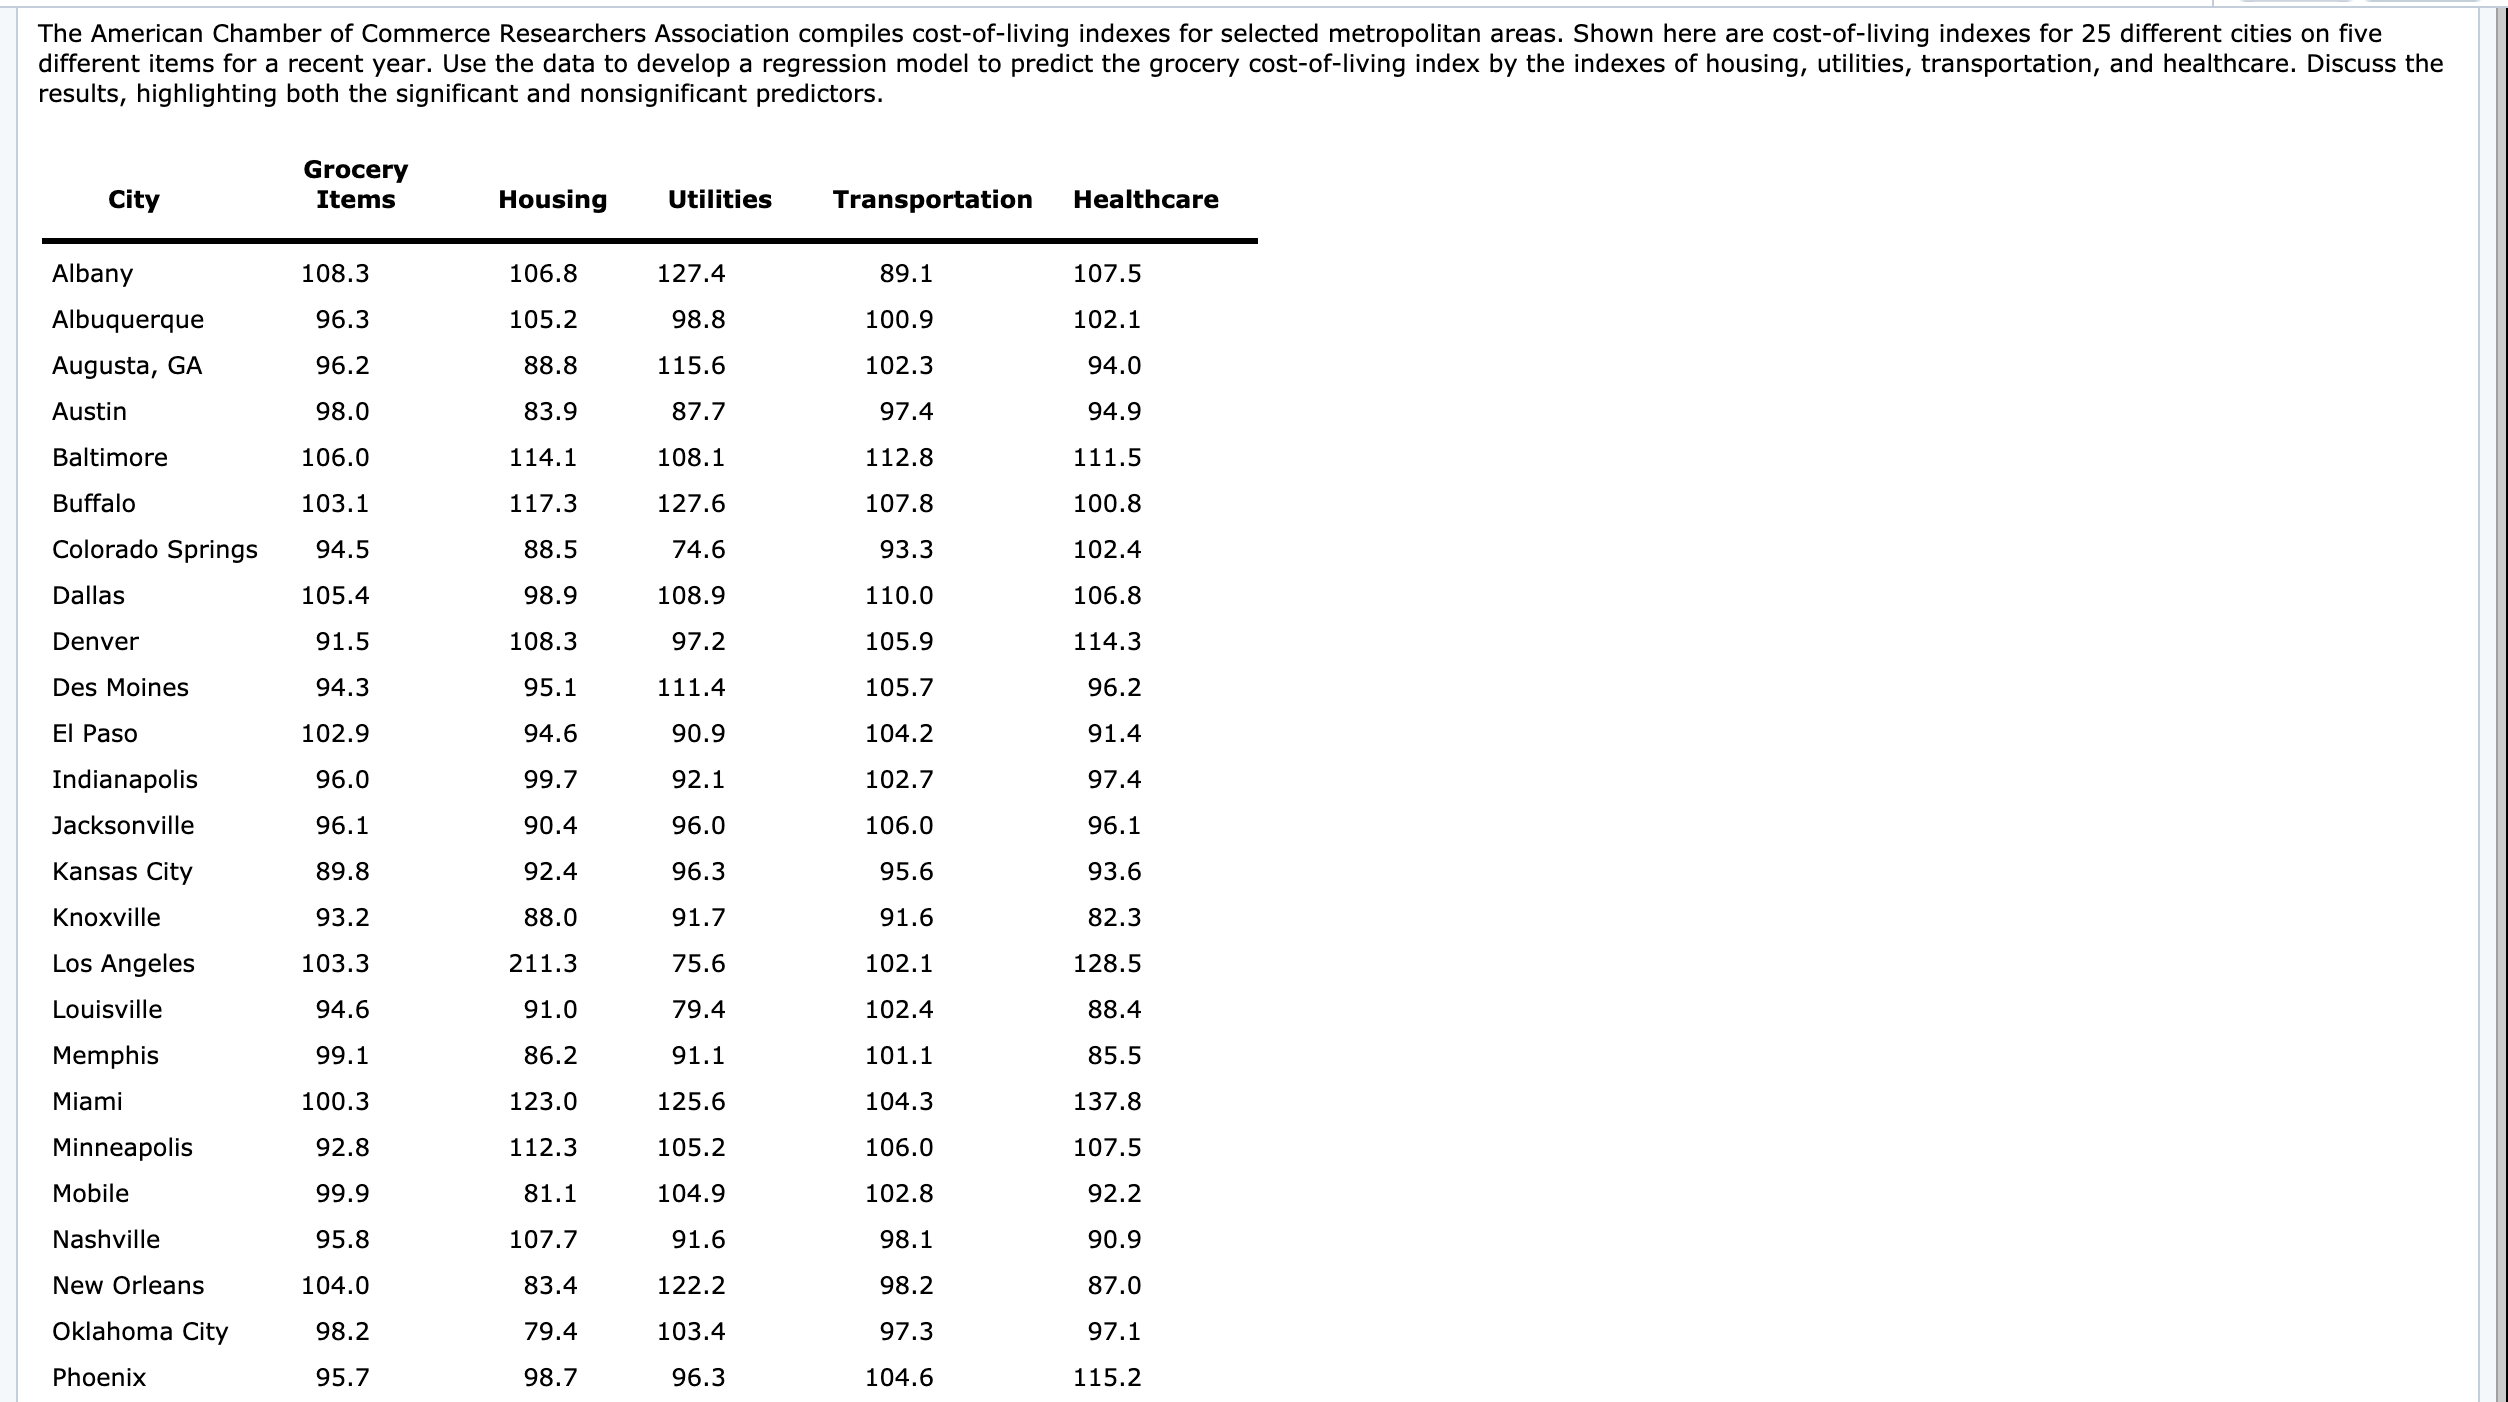
Please do the work on EXCEL and show the process srceenshot
Step by Step Solution
There are 3 Steps involved in it
Step: 1

Get Instant Access to Expert-Tailored Solutions
See step-by-step solutions with expert insights and AI powered tools for academic success
Step: 2

Step: 3
Ace Your Homework with AI
Get the answers you need in no time with our AI-driven, step-by-step assistance
Get Started
Knowledge Audit A Complete Guide
Authors: The Art Of Service - Knowledge Audit Publishing
2021 Edition
1867424010, 978-1867424017