Answered step by step
Verified Expert Solution
Question
1 Approved Answer
Please do this in Matlab. And please take screenshots of code or script as well as the output. Thanks in advance. Question 10) Below is

Please do this in Matlab. And please take screenshots of code or script as well as the output. Thanks in advance.
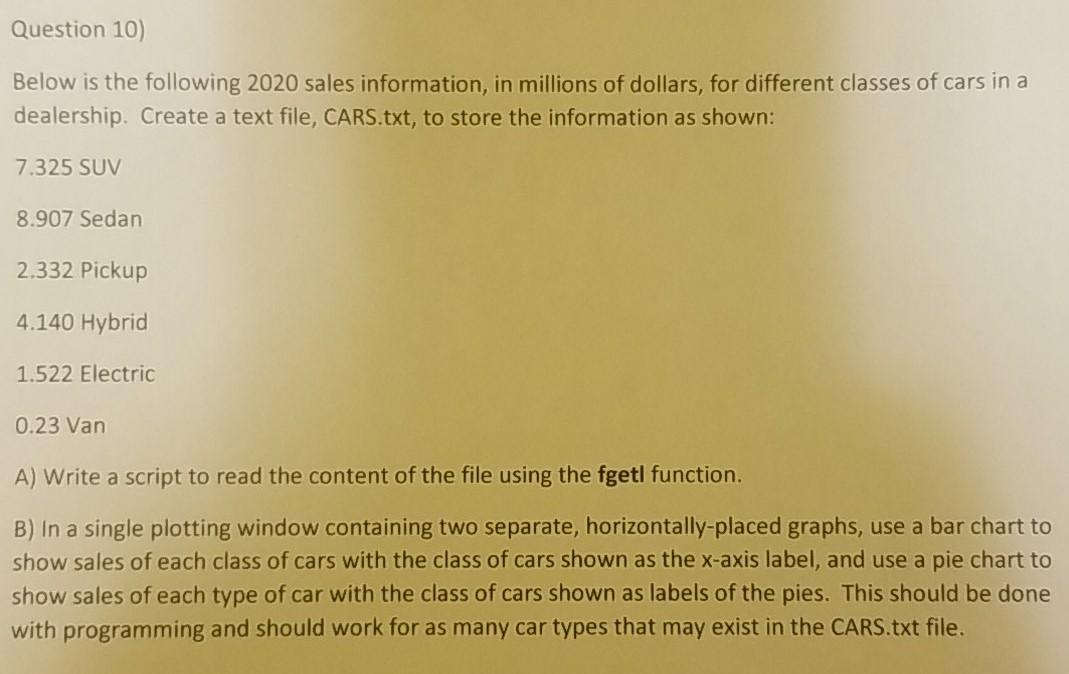
Question 10) Below is the following 2020 sales information, in millions of dollars, for different classes of cars in a dealership. Create a text file, CARS.txt, to store the information as shown: 7.325 SUV 8.907 Sedan 2.332 Pickup 4.140 Hybrid 1.522 Electric 0.23 Van A) Write a script to read the content of the file using the fgetl function. B) In a single plotting window containing two separate, horizontally-placed graphs, use a bar chart to show sales of each class of cars with the class of cars shown as the x-axis label, and use a pie chart to show sales of each type of car with the class of cars shown as labels of the pies. This should be done with programming and should work for as many car types that may exist in the CARS.txt fileStep by Step Solution
There are 3 Steps involved in it
Step: 1

Get Instant Access to Expert-Tailored Solutions
See step-by-step solutions with expert insights and AI powered tools for academic success
Step: 2

Step: 3

Ace Your Homework with AI
Get the answers you need in no time with our AI-driven, step-by-step assistance
Get Started


