

Question
please draw a graph and follow the steps spreadsheet software like Microsoft Excel or Google Sheets. First, create a new spreadsheet and set up the
please draw a graph and follow the steps
spreadsheet software like Microsoft Excel or Google Sheets.
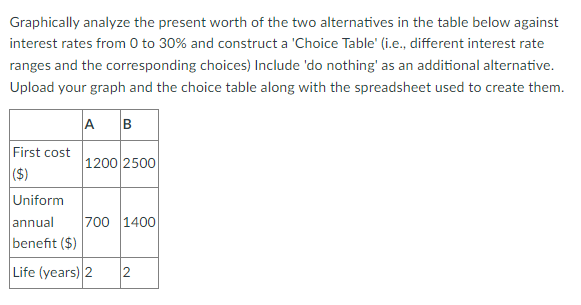
First, create a new spreadsheet and set up the following columns:
Column A: Interest Rate (0% to 30% in increments, e.g., 1% or 5% increments) Column B: Present Worth A Column C: Present Worth B Column D: Do Nothing (always zero)
In the "Interest Rate" column (column A), list down interest rates from 0% to 30% in increments of your choice (e.g., 1% or 5% increments).
Next, calculate the present worth for each alternative A and B for each interest rate using the formula:
PW = (Uniform annual benefit * (1 - (1 + Interest Rate)^(-Life)) / Interest Rate) - First cost
For each interest rate, fill out the respective present worth in columns B and C. The "Do Nothing" option (column D) will have a present worth of 0 at all interest rates.
Now you can create a graph:
- Select the data in columns A, B, C, and D.
- In Microsoft Excel, go to the "Insert" tab and choose "Scatter" from the "Charts" section. Select "Scatter with Straight Lines" to create a graph. In Google Sheets, go to "Insert" and choose "Chart". In the "Chart type" dropdown, select "Scatter chart".
- Adjust the chart title, axis titles, and legend as needed.
To create the choice table:
- Create a new sheet or a new section in your existing sheet.
- Create columns with the following headers: "Interest Rate Range", "Choice"
- For each interest rate range, determine which alternative has the highest present worth (including the "Do Nothing" option) and enter the corresponding choice in the "Choice" column.
Step by Step Solution
There are 3 Steps involved in it
Step: 1

Get Instant Access to Expert-Tailored Solutions
See step-by-step solutions with expert insights and AI powered tools for academic success
Step: 2

Step: 3
Ace Your Homework with AI
Get the answers you need in no time with our AI-driven, step-by-step assistance
Get Started
The Cybersecurity Body Of Knowledge The ACM IEEE AIS IFIP Recommendations For A Complete Curriculum In Cybersecurity Internal Audit And IT Audit
Authors: Daniel Shoemaker, Anne Kohnke, Ken Sigler
1st Edition
1032400218, 978-1032400211