

Answered step by step
Verified Expert Solution
Question
1 Approved Answer
Please draw the graphs in the same format as in Figure 4 . I drew some pictures, please modify them. Thank you so much. project.
Please draw the graphs in the same format as in Figure I drew some pictures, please modify them. Thank you so much. project. For an extended analysis, Figure shows the key performance results of the voting algorithms.
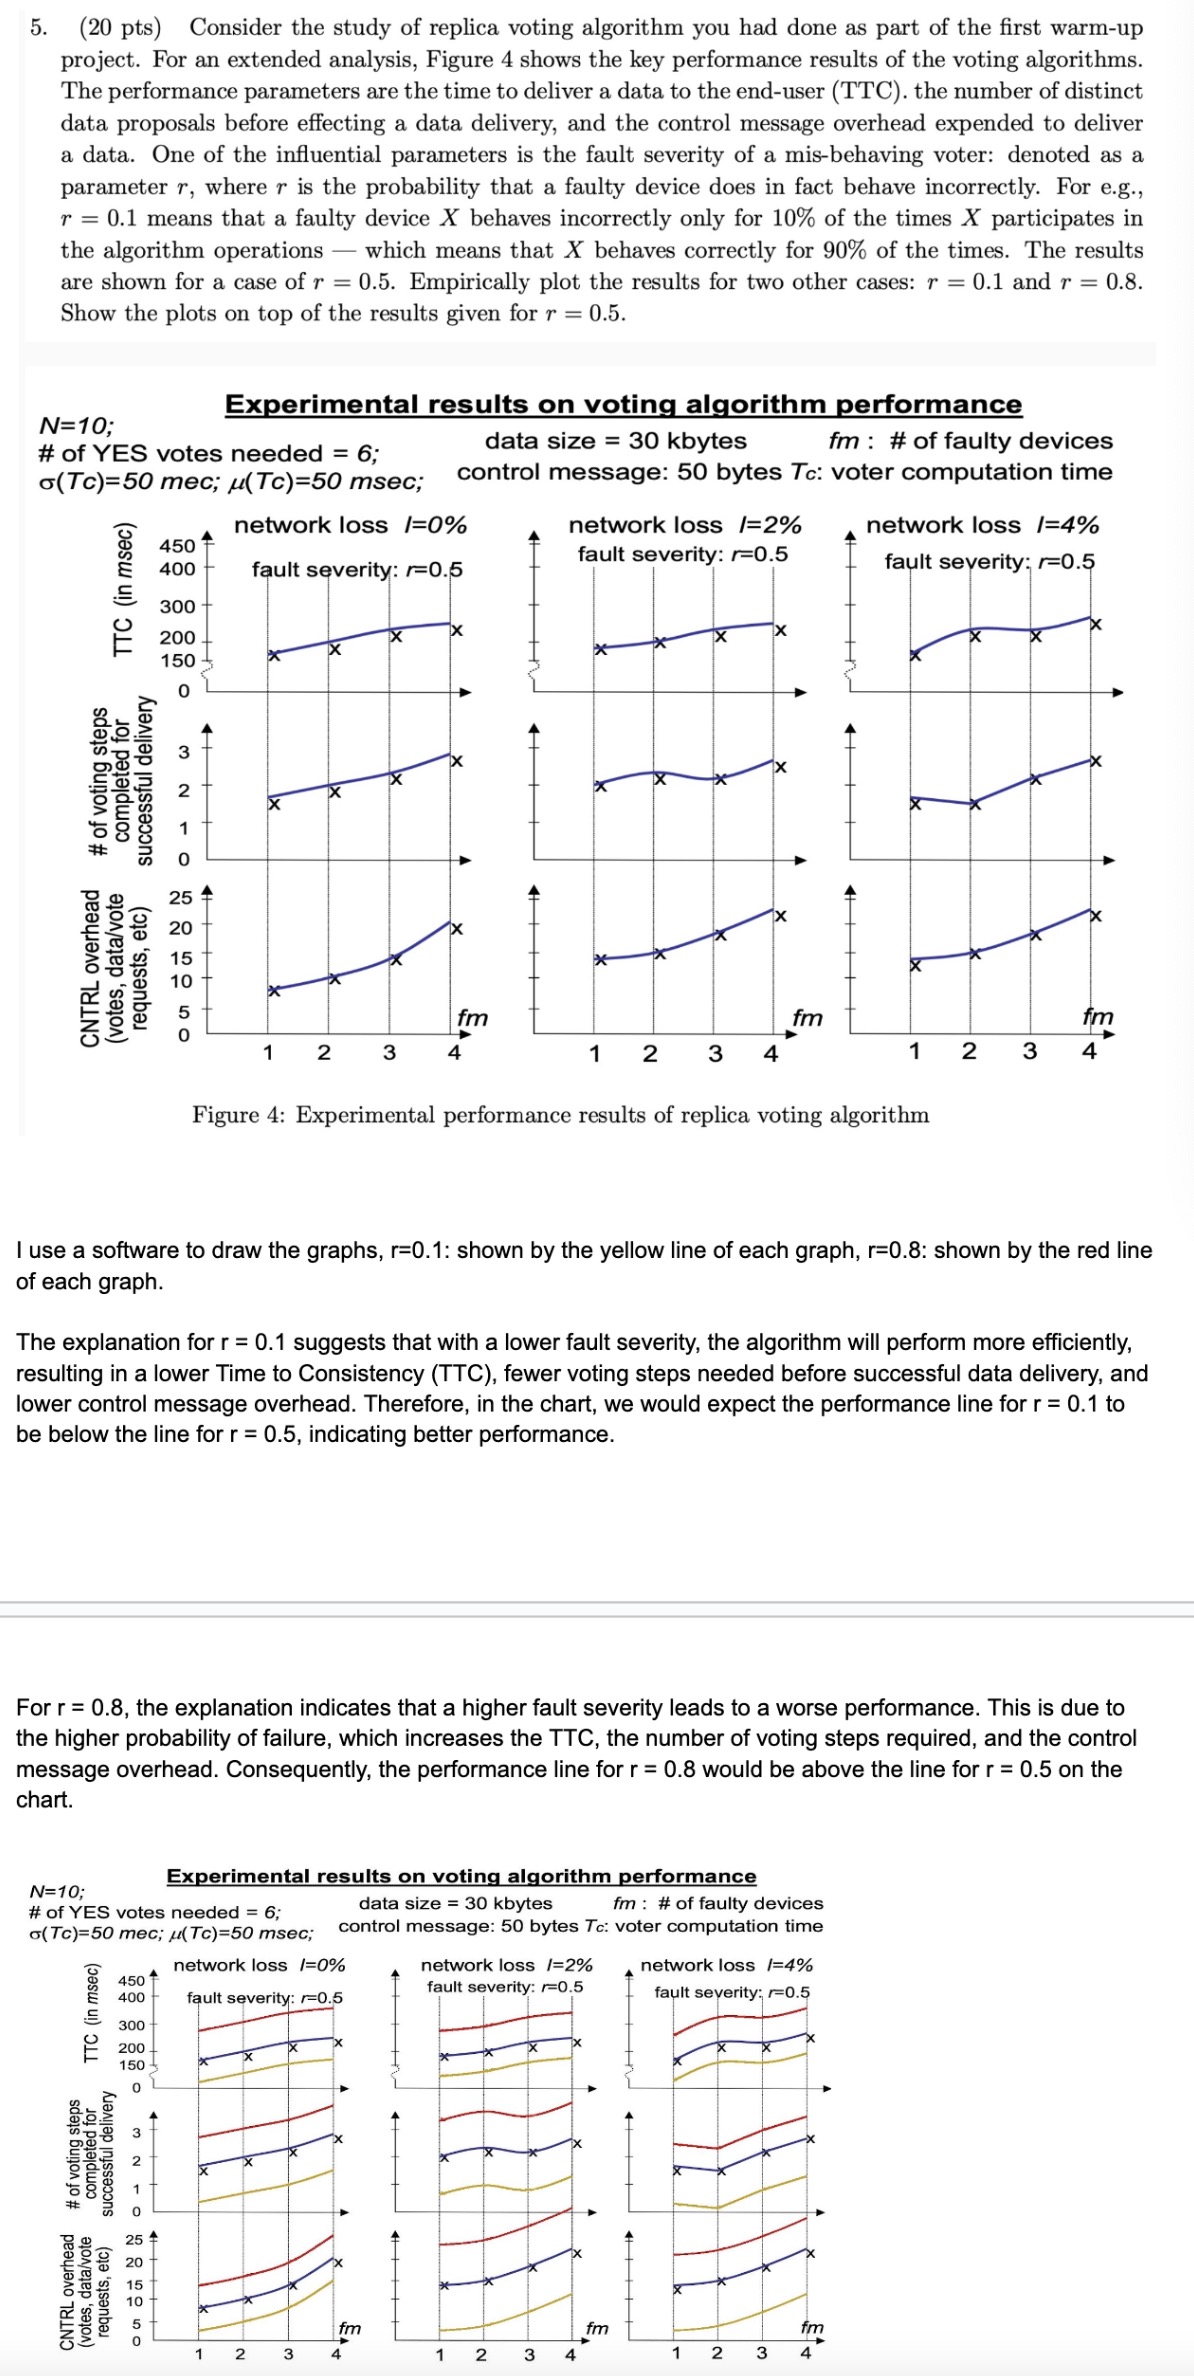
The performance parameters are the time to deliver a data to the enduser TTC the number of distinct
data proposals before effecting a data delivery, and the control message overhead expended to deliver
a data. One of the influential parameters is the fault severity of a misbehaving voter: denoted as a
parameter where is the probability that a faulty device does in fact behave incorrectly. For eg
means that a faulty device behaves incorrectly only for of the times participates in
the algorithm operations which means that behaves correctly for of the times. The results
are shown for a case of Empirically plot the results for two other cases: and
Show the plots on top of the results given for
Figure : Experimental performance results of replica voting algorithm
I use a software to draw the graphs, : shown by the yellow line of each graph, : shown by the red line
of each graph.
The explanation for suggests that with a lower fault severity, the algorithm will perform more efficiently,
resulting in a lower Time to Consistency TTC fewer voting steps needed before successful data delivery, and
lower control message overhead. Therefore, in the chart, we would expect the performance line for to
be below the line for indicating better performance.
For the explanation indicates that a higher fault severity leads to a worse performance. This is due to
the higher probability of failure, which increases the TTC the number of voting steps required, and the control
message overhead. Consequently, the performance line for would be above the line for on the
chart.
Step by Step Solution
There are 3 Steps involved in it
Step: 1

Get Instant Access to Expert-Tailored Solutions
See step-by-step solutions with expert insights and AI powered tools for academic success
Step: 2

Step: 3
Ace Your Homework with AI
Get the answers you need in no time with our AI-driven, step-by-step assistance
Get Started
Intelligent Image Databases Towards Advanced Image Retrieval
Authors: Yihong Gong
1st Edition
1461375037, 978-1461375036