

Answered step by step
Verified Expert Solution
Question
1 Approved Answer
Please draw the grtaphs on top of Figure 4 . ( 2 0 pts ) Consider the study of replica voting algorithm you had done
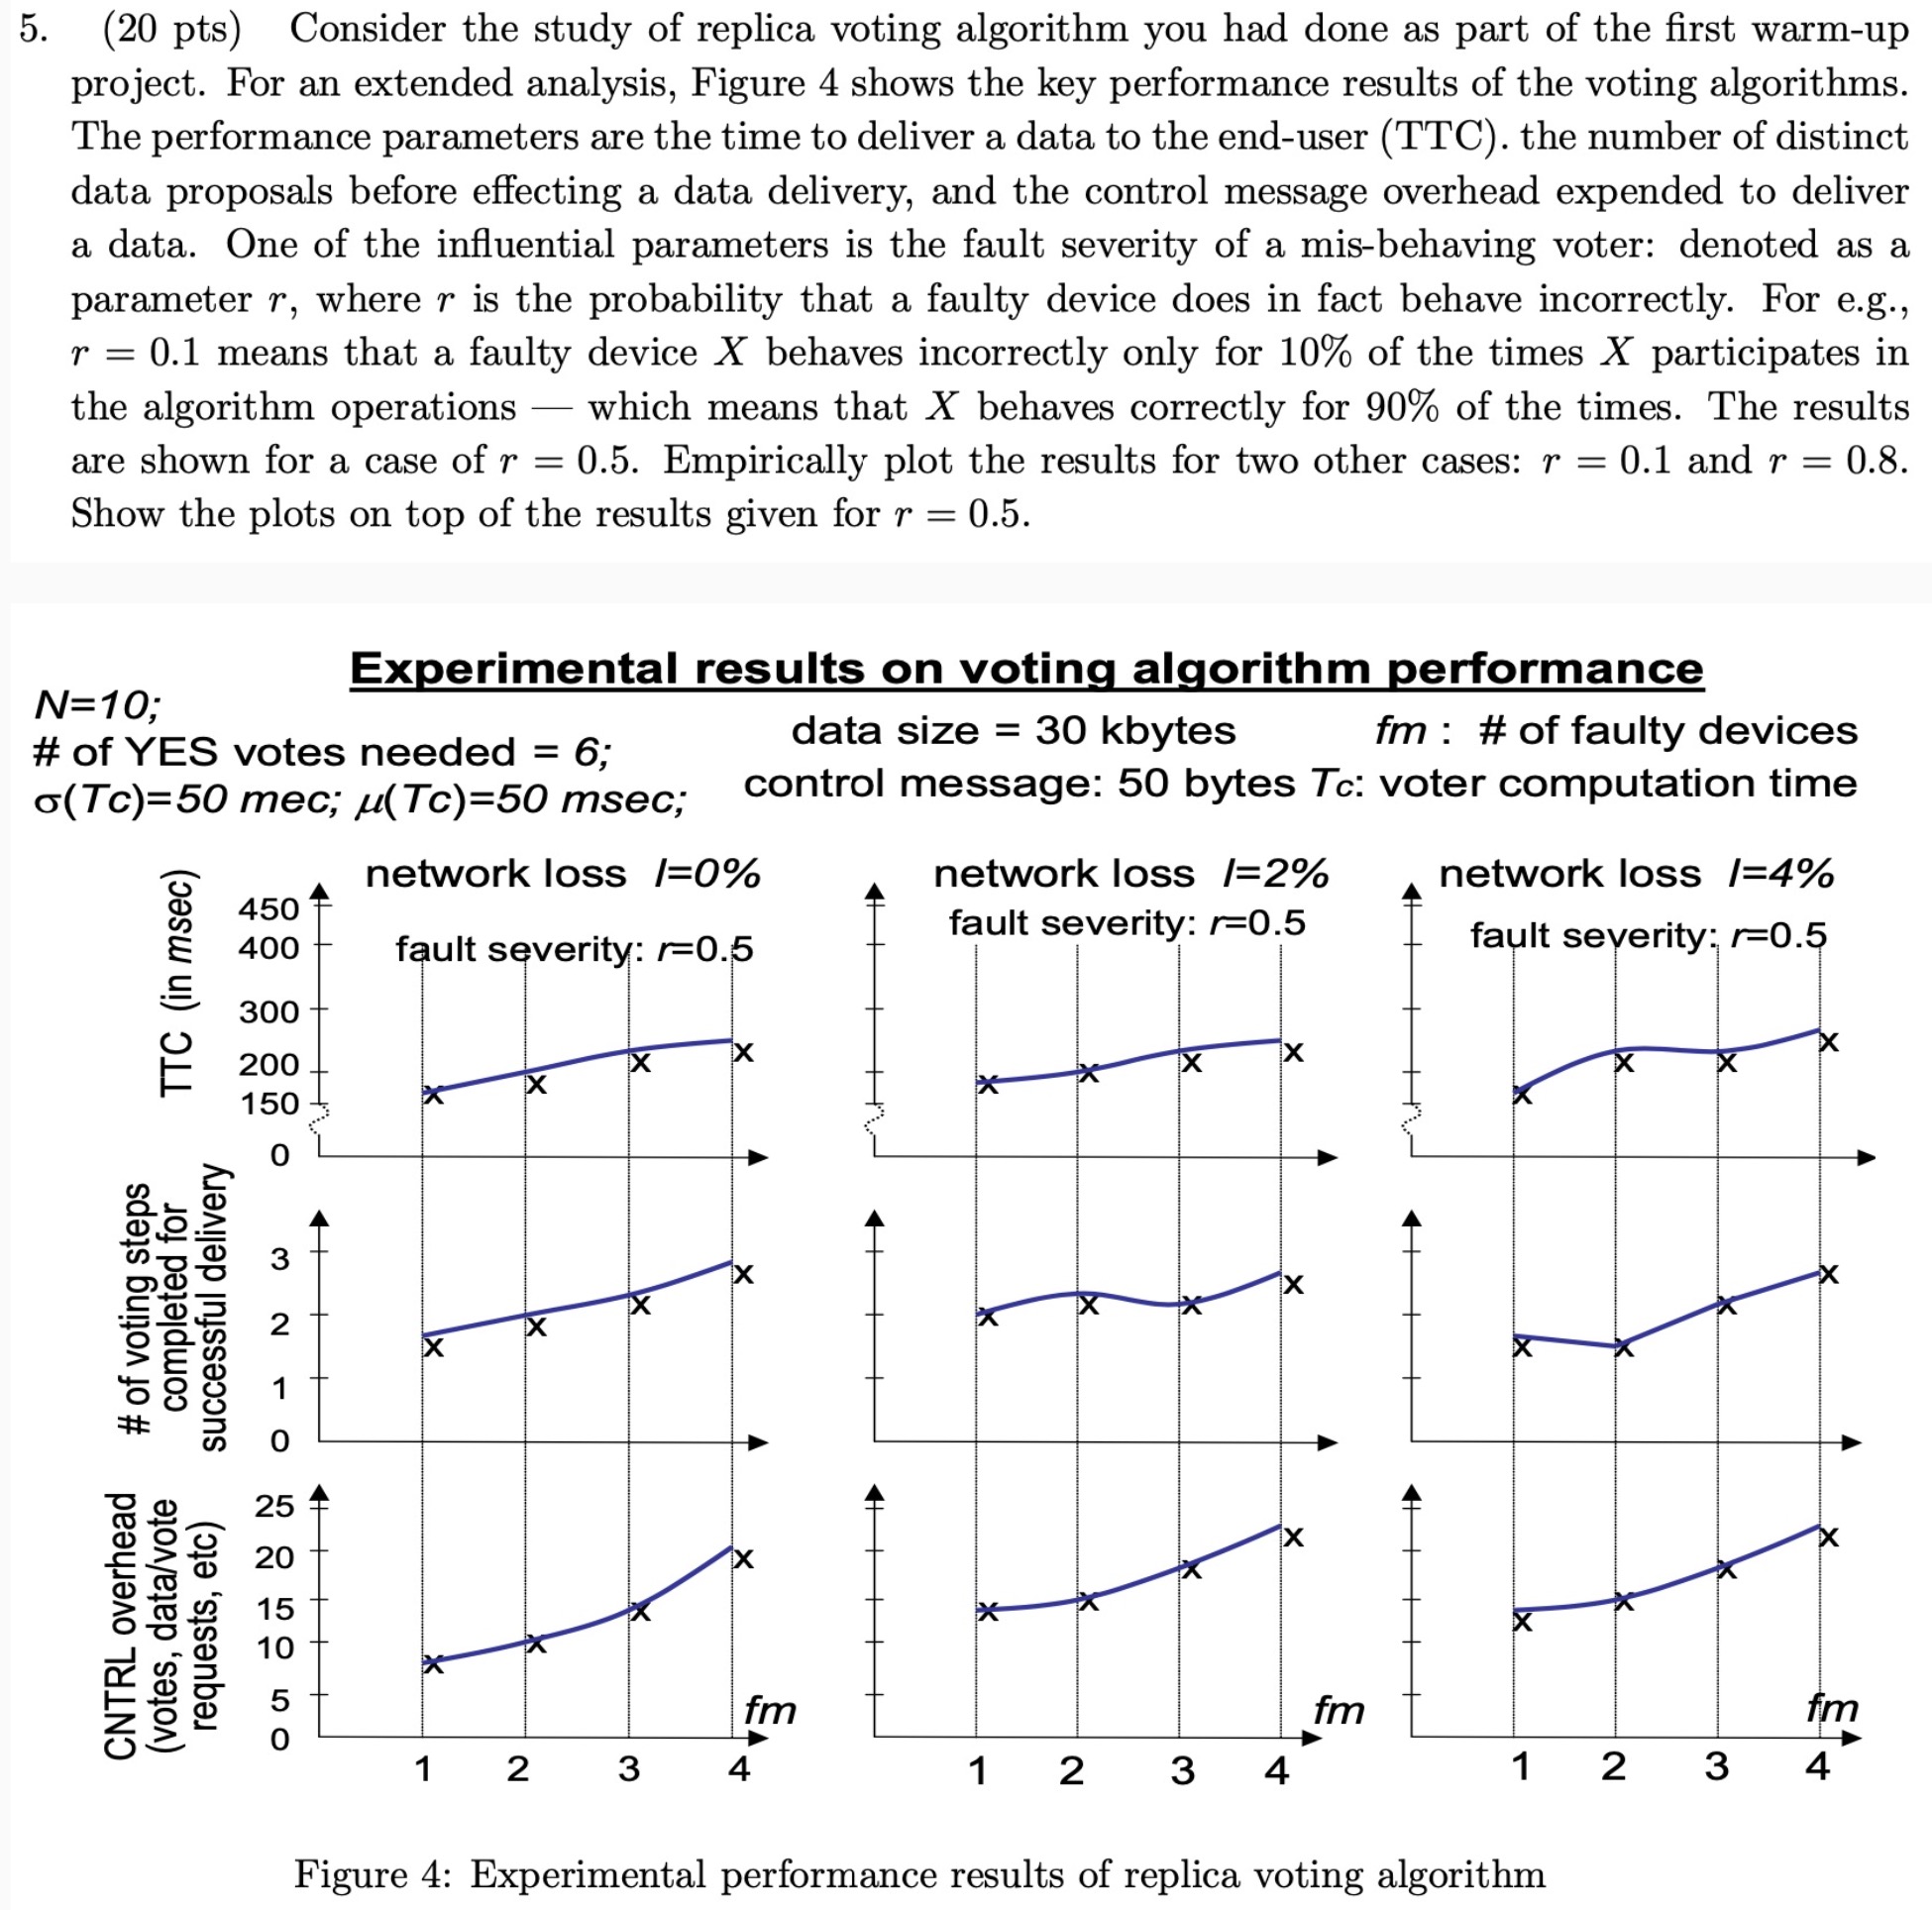
Please draw the grtaphs on top of Figure pts Consider the study of replica voting algorithm you had done as part of the first warmup
project. For an extended analysis, Figure shows the key performance results of the voting algorithms.
The performance parameters are the time to deliver a data to the enduser TTC the number of distinct
data proposals before effecting a data delivery, and the control message overhead expended to deliver
a data. One of the influential parameters is the fault severity of a misbehaving voter: denoted as a
parameter where is the probability that a faulty device does in fact behave incorrectly. For eg
means that a faulty device behaves incorrectly only for of the times participates in
the algorithm operations which means that behaves correctly for of the times. The results
are shown for a case of Empirically plot the results for two other cases: and
Show the plots on top of the results given for
# of YES votes needed ;
mec; msec;
: # of faulty devices
control message: bytes : voter computation time
network loss
Figure : Experimental performance results of replica voting algorithm Thank you very much.
Step by Step Solution
There are 3 Steps involved in it
Step: 1

Get Instant Access to Expert-Tailored Solutions
See step-by-step solutions with expert insights and AI powered tools for academic success
Step: 2

Step: 3
Ace Your Homework with AI
Get the answers you need in no time with our AI-driven, step-by-step assistance
Get Started
Modern Database Management
Authors: Donald A. Carpenter Fred R. McFadden
1st Edition
8178088045, 978-8178088044