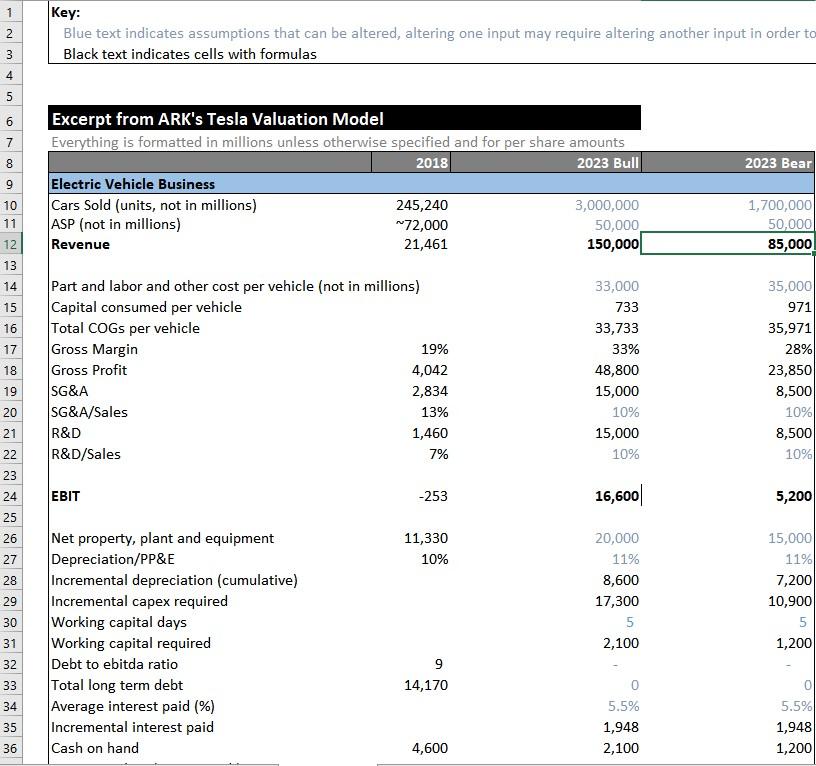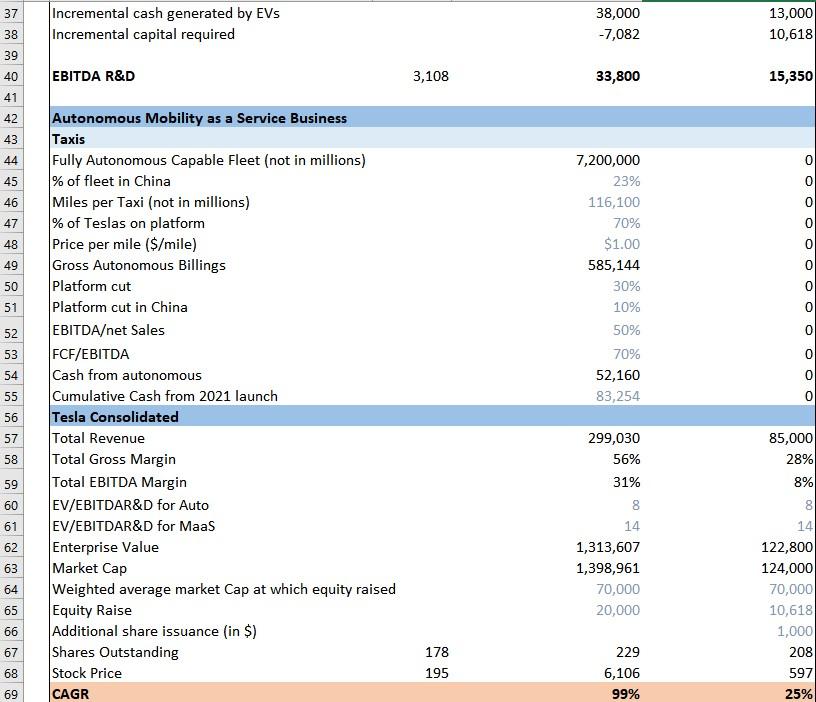

Please enter the correct answer into the yellow cells on the right.
| | | View this Tesla valuation report by Tasha Keeney from ARK Invest, dated May 22nd 2019. | | | | | |
| | | The spreadsheet model named 'Tesla Valuation for Github_5.27.19_v3.5.xlsx' is copied in this workbook in the sheet 'Tesla Model' for you to see. The below questions are based on this model. |
| | | https://ark-invest.com/articles/analyst-research/tesla-valuation-model/ | | | | | | |
| Q9a | 1 | Does ARK value Tesla using DCF or multiples? Write 'DCF' or 'multiples'. | | | | | | |
| Q9b | 1 | Do they value Tesla as a single uniform entity or by summing valuations of multiple divisions? Write 'single' or 'sum'. | | | | |
| Q9c | 1 | What assumptions are made about Tesla's interest-bearing leverage in 2023? Write 'levered' or 'unlevered'. | | | | |
| Q9d | 1 | Does the valuation model include the benefit of interest tax shields? Write 'includes' or 'excludes'. | | | | |
| Q9e | 2 | Based on the current Tesla share price of $620, is this better than the bull scenario, worse than the bear scenario or in between? Write 'better', 'worse' or 'between'. | | |
| | | With regards to the above question, keep in mind that there was a stock split in 2020 that you should adjust for. Ignore timing differences between now and 2023 and simply compare stock prices, adjusted for the stock split. |
| Q9f | 2 | Are the stock prices on line 68 of the Tesla vauation model present values as at 2018 or future values as at 2023? Write '2018' or '2023'. | | | |
1 2 Key: Blue text indicates assumptions that can be altered, altering one input may require altering another input in order to Black text indicates cells with formulas 3 3 4 8 2023 Bear 5 6 7 8 9 10 11 12 Excerpt from ARK's Tesla Valuation Model Everything is formatted in millions unless otherwise specified and for per share amounts 2018 2023 Bull Electric Vehicle Business Cars Sold (units, not in millions) 245,240 3,000,000 ASP (not in millions) ~72,000 50,000 Revenue 21,461 150,000 1,700,000 50,000 85,000 13 35,000 14 15 16 971 17 18 Part and labor and other cost per vehicle (not in millions) Capital consumed per vehicle Total COGs per vehicle Gross Margin 19% Gross Profit 4,042 SG&A 2,834 SG&A/Sales 13% R&D 1,460 R&D/Sales 7% 33,000 733 33,733 33% 48,800 15,000 10% 15,000 10% 19 20 21 35,971 28% 23,850 8,500 10% 8,500 10% EBIT -253 16,600 5,200 NNNN 11,330 10% 28 20,000 11% 8,600 17,300 5 2,100 15,000 11% 7,200 10,900 5 1,200 29 Net property, plant and equipment Depreciation/PP&E Incremental depreciation (cumulative) Incremental capex required Working capital days Working capital required Debt to ebitda ratio Total long term debt Average interest paid (%) Incremental interest paid Cash on hand 30 31 9 14,170 32 33 34 35 0 5.5% 1,948 2,100 5.5% 1,948 1,200 36 4,600 37 Incremental cash generated by EVS Incremental capital required 38,000 -7,082 13,000 10,618 38 39 40 EBITDA R&D 3,108 33,800 15,350 41 42 43 44 45 46 47 48 0 49 50 51 7,200,000 23% 116,100 70% $1.00 585,144 30% 10% 50% 70% 52,160 83,254 0 0 52 0 53 54 Autonomous Mobility as a Service Business Taxis Fully Autonomous Capable Fleet (not in millions) % of fleet in China Miles per Taxi (not in millions) % of Teslas on platform Price per mile ($/mile) Gross Autonomous Billings Platform cut Platform cut in China EBITDAet Sales FCF/EBITDA Cash from autonomous Cumulative Cash from 2021 launch Tesla Consolidated Total Revenue Total Gross Margin Total EBITDA Margin EV/EBITDAR&D for Auto EV/EBITDAR&D for Maas Enterprise Value Market Cap Weighted average market Cap at which equity raised Equity Raise Additional share issuance (in $) Shares Outstanding Stock Price CAGR 55 56 57 58 59 8 8 9 8 299,030 56% 31% 8 14 1,313,607 1,398,961 70,000 20,000 62 63 64 65 85,000 28% 8% 8 14 122,800 124,000 70,000 10,618 1,000 208 597 25% 66 67 178 195 68 229 6,106 99% 69 1 2 Key: Blue text indicates assumptions that can be altered, altering one input may require altering another input in order to Black text indicates cells with formulas 3 3 4 8 2023 Bear 5 6 7 8 9 10 11 12 Excerpt from ARK's Tesla Valuation Model Everything is formatted in millions unless otherwise specified and for per share amounts 2018 2023 Bull Electric Vehicle Business Cars Sold (units, not in millions) 245,240 3,000,000 ASP (not in millions) ~72,000 50,000 Revenue 21,461 150,000 1,700,000 50,000 85,000 13 35,000 14 15 16 971 17 18 Part and labor and other cost per vehicle (not in millions) Capital consumed per vehicle Total COGs per vehicle Gross Margin 19% Gross Profit 4,042 SG&A 2,834 SG&A/Sales 13% R&D 1,460 R&D/Sales 7% 33,000 733 33,733 33% 48,800 15,000 10% 15,000 10% 19 20 21 35,971 28% 23,850 8,500 10% 8,500 10% EBIT -253 16,600 5,200 NNNN 11,330 10% 28 20,000 11% 8,600 17,300 5 2,100 15,000 11% 7,200 10,900 5 1,200 29 Net property, plant and equipment Depreciation/PP&E Incremental depreciation (cumulative) Incremental capex required Working capital days Working capital required Debt to ebitda ratio Total long term debt Average interest paid (%) Incremental interest paid Cash on hand 30 31 9 14,170 32 33 34 35 0 5.5% 1,948 2,100 5.5% 1,948 1,200 36 4,600 37 Incremental cash generated by EVS Incremental capital required 38,000 -7,082 13,000 10,618 38 39 40 EBITDA R&D 3,108 33,800 15,350 41 42 43 44 45 46 47 48 0 49 50 51 7,200,000 23% 116,100 70% $1.00 585,144 30% 10% 50% 70% 52,160 83,254 0 0 52 0 53 54 Autonomous Mobility as a Service Business Taxis Fully Autonomous Capable Fleet (not in millions) % of fleet in China Miles per Taxi (not in millions) % of Teslas on platform Price per mile ($/mile) Gross Autonomous Billings Platform cut Platform cut in China EBITDAet Sales FCF/EBITDA Cash from autonomous Cumulative Cash from 2021 launch Tesla Consolidated Total Revenue Total Gross Margin Total EBITDA Margin EV/EBITDAR&D for Auto EV/EBITDAR&D for Maas Enterprise Value Market Cap Weighted average market Cap at which equity raised Equity Raise Additional share issuance (in $) Shares Outstanding Stock Price CAGR 55 56 57 58 59 8 8 9 8 299,030 56% 31% 8 14 1,313,607 1,398,961 70,000 20,000 62 63 64 65 85,000 28% 8% 8 14 122,800 124,000 70,000 10,618 1,000 208 597 25% 66 67 178 195 68 229 6,106 99% 69


