

Answered step by step
Verified Expert Solution
Question
1 Approved Answer
Please explain answer, so I have a clear understanding of how it was reached. 121176 - Journal of Business Cases and Applications EVA IS INDIRECTLY
Please explain answer, so I have a clear understanding of how it was reached.
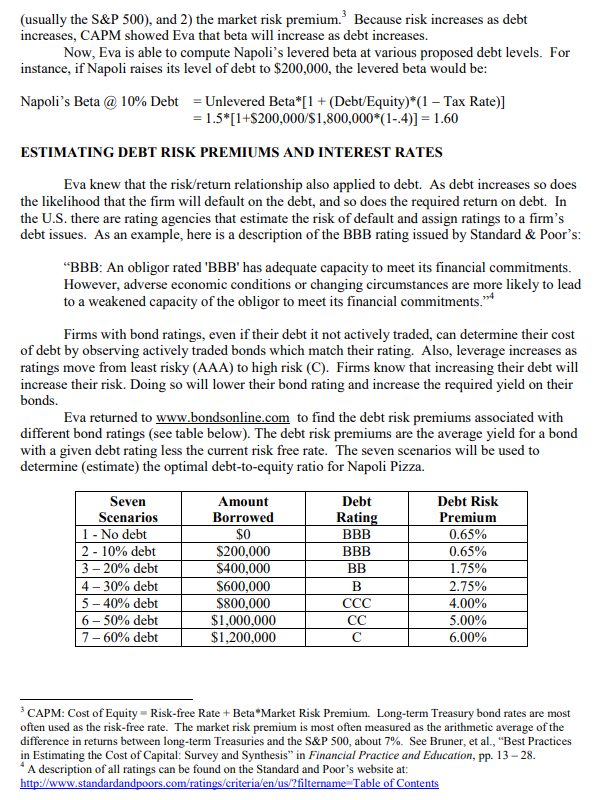
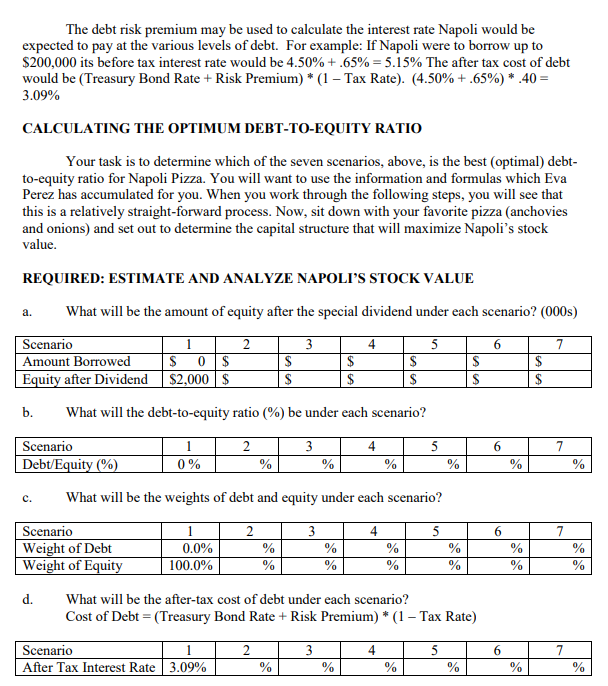
121176 - Journal of Business Cases and Applications EVA IS INDIRECTLY ASKED TO FIND AN OPTIMAL CAPITAL STRUCTURE Eva Perez was recently hired as Business Manager of Napoli Pizza and she is anxious to show off her MBA skills to her new employers. Once settled into her job, Eva realized that this very successful, family-owned business was financed entirely with equity. While there can be appropriate reasons for this type of capital structure, Eva knew from her finance course that most equity holders would be financially better off if the capital structure included some level of debt. The interesting question is: how much debt relative to equity? Being new, and not being part of the ownership family, Eva was not sure whether to raise this question with her employers. Unknown to Eva, Joseph Romano, patriarch and principal owner of Napoli Pizza, had been approached by several family members. While Napoli Pizza's earnings and cash flows) provide the family with supplemental income, most of its value is in the common equity shares held by the family. The family wondered if there was a way to enjoy the financial benefits of that equity. Joseph didn't know, but he wondered if Eva's MBA education could help them find an answer. Eva smiled when Joseph Romano spoke with her the next day. He was asking the question that she wanted to ask. Eva exclaimed, Mr. Romano! That is the very thing I had been wondering about." Remembering her finance training, Eva explained that there is an optimal relationship between debt and equity; a point at which the market value of equity will be maximized. Eva was certain she could perform the necessary calculations and the amount of debt raised would provide the financial benefit that the family desired. If Napoli recapitalized with debt, the borrowed funds would be used to pay a one-time, special cash dividend to its current stockholders. The family members would receive a cash payout and the company would attain an optimal capital structure. The best of all worlds!" NAPOLI PIZZA Napoli Pizza is a popular pizza restaurant and bar located in a mid-sized, Midwestern city. It has been very successful serving outstanding food and beverages in a trendy atmosphere and location. Napoli caters to a working-professional lunch crowd, a family-oriented dinner crowd, and a young night-life bar crowd. Due to its success, the company's earnings before interest and taxes (EBIT) was $500,000 last year and, because the business has settled into a comfortable market position and no expansion is planned, earnings are expected to remain constant (in real terms) over time. Joseph Romano started Napoli Pizza ten years ago with his family members as the initial employees (his children and his siblings and their children). As the business prospered, allowing Joseph to hire non-family employees, many of the original family group left for college and other pursuits. However, over the years, Joseph has given stock to each member of the family, and he has regularly paid out all earnings as cash dividends. Joseph owns 30% of the outstanding shares, and his three sons each own 10% (although Joseph holds the voting rights on those shares). Paul Romano and his two sons each own 5%, as does Carlo Romano, Carlo's two daughters, Lorraine Romano and Lorraine's son. Eva's review of the company's financial records showed that Napoli is currently financed with all equity and has 100,000 shares outstanding. Napoli is in a 40% federal plus state tax bracket. The company leases all of its equipment and its building. Therefore, Napoli has no depreciation expense. One problem Eva has is that Napoli Pizza is not publicly traded and, therefore it has no market price. Eva knew from her finance training that she can use estimated cash flows, weighted average cost of capital (WACC), and the capital asset pricing model (CAPM) to estimate the current value of the stock. She can use the same approach to estimate the debt and equity relationship that would maximize equity value. This is the optimum debt to equity ratio. A second problem Eva has is that because Napoli Pizza is not publicly traded, and therefore it has no market price, she cannot directly calculate the company's beta. She does recall her finance professor saying that a firm that is not publicly traded, like Napoli, may estimate its beta using betas from similar firms in the same industry that are publicly traded. ESTIMATING CURRENT UNLEVERED BETA Searching through her old MBA notes, Eva found the following:' Levered Beta = Unlevered Beta*[1 + (Debt/Equity)*(1 Tax Rate)] Eva saw that unlevered beta reflects the firm's operational business) risk and would be used to compute cost of equity if the firm had no debt. Levered beta combines the firm's operational risk and its financial risk (the risk due to leverage). Eva had to ponder this for a while. It slowly became clear, if a firm that is not publicly traded wants to calculate its cost of equity and examine the impact of a change in capital structure on its firm value, it can use this formula to estimate its own beta. First, she could unlever betas for firms like Napoli to find a beta for Napoli that would reflect its operational risk. She could then relever the beta to see the effect of leverage on the value of Napoli. Eva estimated Napoli's current unlevered beta, as follows: Using Yahoo! Finance, Eva found the betas, tax rates and debt-to-equity values for two publicly traded firms in the same industry, the first with.86, 40% and 0%, respectively, and the second with 1.73, 40%, and 36%, respectively. Using the levered beta formula, Eva un-levered and averaged their betas to estimate an all equity beta for Napoli Pizza. Eva rearranged the formula as follows: Unlevered Beta = Levered Beta / [1 + (Debt/Equity)*(1 Tax Rate)] Firm A Unlevered 0.86/(1+0*(1-4)] = 0.86 Firm B Unlevered 1.73/[1+.36*(1-4)] = 1.42 Un-levered, all equity beta (.86 +1.4272 = 1.14 A large publicly traded firm with similar operational risk (the risk of being in the casual dining business) to the two firms Eva identified with no debt might be expected to have a beta of 1.14. However, Eva knew that Napoli may have greater operational risk than these firms because: 1) it is a small, regional firm more susceptible to swings in the local market, and 2) it While there are other theoretical models, this model and Levered Beta Unlevered Beta*1 + (Debt/Equity) are the most commonly used in practice. See working paper no. 488 "Levered and Unlevered Beta" from the IESE Business School by Pablo Fernandez (2006) for a more detailed discussion of the theoretical models. lacks the economies of scale that these larger national firms have. Based on this, Eva subjectively revised the estimate of the unlevered beta upward (more risk, higher beta) to 1.5. ESTIMATING CURRENT MARKET VALUE With this estimated beta, Eva was able to estimate the market value of the stock using estimated cash flows, weighted average cost of capital (WACC), and the capital asset pricing model (CAPM). Eva used www.bondsonline.com to find a proxy for the current risk-free rate of 4.50% (the 30-year Treasury bond rate). Also, based on the differences in historical returns between the S&P 500 and the 30-year Treasury bond rate (Market Return Risk-free Rate), she estimated the market risk premium to be 7%. Her calculations were as follows: Risk-free Rate + Beta (Market Risk Premium) = CAPM (Cost of Equity) 4.5% + 1.5 (7%) = 15% (Weight of Debt * Cost of Debt) + (Weight of Equity * Cost of Equity)= WACC Because there is no debt, WACC = CAPM (15%) (Earnings before Interest and Taxes (EBIT) Interest) * (1 - Tax Rate) + Depreciation = Estimated Cash Flow ($500,000 - $0) * (1-.40) + $0 = $300,000 (No Interest or Depreciation) Estimated Cash Flow / WAAC = Estimated Asset Value - Liabilities - Estimated Equity Value $300,000 / 15%= $2,000,000 - $0 = $2,000,000 (No Liabilities) Estimated Equity Value/Shares Outstanding = Estimated Market Value per Share $2,000,000/100,000 shares = $20.00 per share ESTIMATING LEVERED BETAS Eva next read her old MBA notes to remind herself about the relationship between debt and equity. Yes, two things were very clear. Although a firm benefits from the tax shield provided by debt (interest payments reduce the firm's tax burden), increasing levels of debt also increase the firm's chance of becoming financially distressed. Also, common shareholders are residual claimants and in bankruptcy they are paid only after all other claimants, including debt holders, are paid. For both of those reasons, as debt increases so does equity risk. Eva knew from the risk/return relationship, as the risk of an investment increases investors demand a higher return. So, as debt increases, equity holders should demand a higher return. The notes on risk and return led Eva back to the Capital Asset Pricing Model (CAPM). In CAPM the risk of a company's stock is measured relative to the risk-free rate the return on Treasury securities) by: 1) beta, which measures the stock's return relative to the market's return (usually the S&P 500), and 2) the market risk premium. Because risk increases as debt increases, CAPM showed Eva that beta will increase as debt increases. Now, Eva is able to compute Napoli's levered beta at various proposed debt levels. For instance, if Napoli raises its level of debt to $200,000, the levered beta would be: Napoli's Beta @ 10% Debt = Unlevered Beta*[1 + (Debt/Equity)*(1 Tax Rate)] = 1.5*(1+$200,000/$1,800,000*(1-.4)] = 1.60 ESTIMATING DEBT RISK PREMIUMS AND INTEREST RATES Eva knew that the risk/return relationship also applied to debt. As debt increases so does the likelihood that the firm will default on the debt, and so does the required return on debt. In the U.S. there are rating agencies that estimate the risk of default and assign ratings to a firm's debt issues. As an example, here is a description of the BBB rating issued by Standard & Poor's: "BBB: An obligor rated 'BBB' has adequate capacity to meet its financial commitments. However, adverse economic conditions or changing circumstances are more likely to lead to a weakened capacity of the obligor to meet its financial commitments.94 Firms with bond ratings, even if their debt it not actively traded, can determine their cost of debt by observing actively traded bonds which match their rating. Also, leverage increases as ratings move from least risky (AAA) to high risk (C). Firms know that increasing their debt will increase their risk. Doing so will lower their bond rating and increase the required yield on their bonds. Eva returned to www.bondsonline.com to find the debt risk premiums associated with different bond ratings (see table below). The debt risk premiums are the average yield for a bond with a given debt rating less the current risk free rate. The seven scenarios will be used to determine (estimate) the optimal debt-to-equity ratio for Napoli Pizza. Seven Scenarios 1 - No debt 2 - 10% debt 3-20% debt 4-30% debt 5-40% debt 6- 50% debt 7- 60% debt Amount Borrowed $0 $200,000 $400,000 $600,000 $800,000 $1,000,000 $1,200,000 Debt Rating BBB BBB BB B CC Debt Risk Premium 0.65% 0.65% 1.75% 2.75% 4.00% 5.00% 6.00% CAPM: Cost of Equity Risk-free Rate + BetaMarket Risk Premium. Long-term Treasury bond rates are most often used as the risk-free rate. The market risk premium is most often measured as the arithmetic average of the difference in returns between long-term Treasures and the S&P 500, about 7%. See Bruner, et al., "Best Practices in Estimating the Cost of Capital: Survey and Synthesis in Financial Practice and Education, pp. 13 - 28. * A description of all ratings can be found on the Standard and Poor's website at: http://www.standardandpoors.com/ratings/criteria/en/us/?filtername-Table of Contents The debt risk premium may be used to calculate the interest rate Napoli would be expected to pay at the various levels of debt. For example: If Napoli were to borrow up to $200,000 its before tax interest rate would be 4.50% +.65% = 5.15% The after tax cost of debt would be (Treasury Bond Rate + Risk Premium) * (1 Tax Rate). (4.50%+.65%) *.40 = 3.09% CALCULATING THE OPTIMUM DEBT-TO-EQUITY RATIO Your task is to determine which of the seven scenarios, above, is the best (optimal) debt- to-equity ratio for Napoli Pizza. You will want to use the information and formulas which Eva Perez has accumulated for you. When you work through the following steps, you will see that this is a relatively straight-forward process. Now, sit down with your favorite pizza (anchovies and onions) and set out to determine the capital structure that will maximize Napoli's stock value. REQUIRED: ESTIMATE AND ANALYZE NAPOLI'S STOCK VALUE What will be the amount of equity after the special dividend under each scenario? (000s) a. 2 3 5 6 7 Scenario Amount Borrowed Equity after Dividend 1 $0 $ $2,000 $ $ $ 4 $ $ S $ S S $ $ b. What will the debt-to-equity ratio (%) be under each scenario? 2 3 4 5 6 7 Scenario Debt/Equity (%) 0 % % % 0% 70 % 04 70 % c. What will be the weights of debt and equity under each scenario? 3 5 6 7 Scenario Weight of Debt Weight of Equity 0.0% 100.0% 2 % % 70 0 4 % % % % % % % % % d. What will be the after-tax cost of debt under each scenario? Cost of Debt = (Treasury Bond Rate + Risk Premium) * (1 - Tax Rate) Scenario After Tax Interest Rate 3.09% 3 % 6 % % % % % 121176 - Journal of Business Cases and Applications EVA IS INDIRECTLY ASKED TO FIND AN OPTIMAL CAPITAL STRUCTURE Eva Perez was recently hired as Business Manager of Napoli Pizza and she is anxious to show off her MBA skills to her new employers. Once settled into her job, Eva realized that this very successful, family-owned business was financed entirely with equity. While there can be appropriate reasons for this type of capital structure, Eva knew from her finance course that most equity holders would be financially better off if the capital structure included some level of debt. The interesting question is: how much debt relative to equity? Being new, and not being part of the ownership family, Eva was not sure whether to raise this question with her employers. Unknown to Eva, Joseph Romano, patriarch and principal owner of Napoli Pizza, had been approached by several family members. While Napoli Pizza's earnings and cash flows) provide the family with supplemental income, most of its value is in the common equity shares held by the family. The family wondered if there was a way to enjoy the financial benefits of that equity. Joseph didn't know, but he wondered if Eva's MBA education could help them find an answer. Eva smiled when Joseph Romano spoke with her the next day. He was asking the question that she wanted to ask. Eva exclaimed, Mr. Romano! That is the very thing I had been wondering about." Remembering her finance training, Eva explained that there is an optimal relationship between debt and equity; a point at which the market value of equity will be maximized. Eva was certain she could perform the necessary calculations and the amount of debt raised would provide the financial benefit that the family desired. If Napoli recapitalized with debt, the borrowed funds would be used to pay a one-time, special cash dividend to its current stockholders. The family members would receive a cash payout and the company would attain an optimal capital structure. The best of all worlds!" NAPOLI PIZZA Napoli Pizza is a popular pizza restaurant and bar located in a mid-sized, Midwestern city. It has been very successful serving outstanding food and beverages in a trendy atmosphere and location. Napoli caters to a working-professional lunch crowd, a family-oriented dinner crowd, and a young night-life bar crowd. Due to its success, the company's earnings before interest and taxes (EBIT) was $500,000 last year and, because the business has settled into a comfortable market position and no expansion is planned, earnings are expected to remain constant (in real terms) over time. Joseph Romano started Napoli Pizza ten years ago with his family members as the initial employees (his children and his siblings and their children). As the business prospered, allowing Joseph to hire non-family employees, many of the original family group left for college and other pursuits. However, over the years, Joseph has given stock to each member of the family, and he has regularly paid out all earnings as cash dividends. Joseph owns 30% of the outstanding shares, and his three sons each own 10% (although Joseph holds the voting rights on those shares). Paul Romano and his two sons each own 5%, as does Carlo Romano, Carlo's two daughters, Lorraine Romano and Lorraine's son. Eva's review of the company's financial records showed that Napoli is currently financed with all equity and has 100,000 shares outstanding. Napoli is in a 40% federal plus state tax bracket. The company leases all of its equipment and its building. Therefore, Napoli has no depreciation expense. One problem Eva has is that Napoli Pizza is not publicly traded and, therefore it has no market price. Eva knew from her finance training that she can use estimated cash flows, weighted average cost of capital (WACC), and the capital asset pricing model (CAPM) to estimate the current value of the stock. She can use the same approach to estimate the debt and equity relationship that would maximize equity value. This is the optimum debt to equity ratio. A second problem Eva has is that because Napoli Pizza is not publicly traded, and therefore it has no market price, she cannot directly calculate the company's beta. She does recall her finance professor saying that a firm that is not publicly traded, like Napoli, may estimate its beta using betas from similar firms in the same industry that are publicly traded. ESTIMATING CURRENT UNLEVERED BETA Searching through her old MBA notes, Eva found the following:' Levered Beta = Unlevered Beta*[1 + (Debt/Equity)*(1 Tax Rate)] Eva saw that unlevered beta reflects the firm's operational business) risk and would be used to compute cost of equity if the firm had no debt. Levered beta combines the firm's operational risk and its financial risk (the risk due to leverage). Eva had to ponder this for a while. It slowly became clear, if a firm that is not publicly traded wants to calculate its cost of equity and examine the impact of a change in capital structure on its firm value, it can use this formula to estimate its own beta. First, she could unlever betas for firms like Napoli to find a beta for Napoli that would reflect its operational risk. She could then relever the beta to see the effect of leverage on the value of Napoli. Eva estimated Napoli's current unlevered beta, as follows: Using Yahoo! Finance, Eva found the betas, tax rates and debt-to-equity values for two publicly traded firms in the same industry, the first with.86, 40% and 0%, respectively, and the second with 1.73, 40%, and 36%, respectively. Using the levered beta formula, Eva un-levered and averaged their betas to estimate an all equity beta for Napoli Pizza. Eva rearranged the formula as follows: Unlevered Beta = Levered Beta / [1 + (Debt/Equity)*(1 Tax Rate)] Firm A Unlevered 0.86/(1+0*(1-4)] = 0.86 Firm B Unlevered 1.73/[1+.36*(1-4)] = 1.42 Un-levered, all equity beta (.86 +1.4272 = 1.14 A large publicly traded firm with similar operational risk (the risk of being in the casual dining business) to the two firms Eva identified with no debt might be expected to have a beta of 1.14. However, Eva knew that Napoli may have greater operational risk than these firms because: 1) it is a small, regional firm more susceptible to swings in the local market, and 2) it While there are other theoretical models, this model and Levered Beta Unlevered Beta*1 + (Debt/Equity) are the most commonly used in practice. See working paper no. 488 "Levered and Unlevered Beta" from the IESE Business School by Pablo Fernandez (2006) for a more detailed discussion of the theoretical models. lacks the economies of scale that these larger national firms have. Based on this, Eva subjectively revised the estimate of the unlevered beta upward (more risk, higher beta) to 1.5. ESTIMATING CURRENT MARKET VALUE With this estimated beta, Eva was able to estimate the market value of the stock using estimated cash flows, weighted average cost of capital (WACC), and the capital asset pricing model (CAPM). Eva used www.bondsonline.com to find a proxy for the current risk-free rate of 4.50% (the 30-year Treasury bond rate). Also, based on the differences in historical returns between the S&P 500 and the 30-year Treasury bond rate (Market Return Risk-free Rate), she estimated the market risk premium to be 7%. Her calculations were as follows: Risk-free Rate + Beta (Market Risk Premium) = CAPM (Cost of Equity) 4.5% + 1.5 (7%) = 15% (Weight of Debt * Cost of Debt) + (Weight of Equity * Cost of Equity)= WACC Because there is no debt, WACC = CAPM (15%) (Earnings before Interest and Taxes (EBIT) Interest) * (1 - Tax Rate) + Depreciation = Estimated Cash Flow ($500,000 - $0) * (1-.40) + $0 = $300,000 (No Interest or Depreciation) Estimated Cash Flow / WAAC = Estimated Asset Value - Liabilities - Estimated Equity Value $300,000 / 15%= $2,000,000 - $0 = $2,000,000 (No Liabilities) Estimated Equity Value/Shares Outstanding = Estimated Market Value per Share $2,000,000/100,000 shares = $20.00 per share ESTIMATING LEVERED BETAS Eva next read her old MBA notes to remind herself about the relationship between debt and equity. Yes, two things were very clear. Although a firm benefits from the tax shield provided by debt (interest payments reduce the firm's tax burden), increasing levels of debt also increase the firm's chance of becoming financially distressed. Also, common shareholders are residual claimants and in bankruptcy they are paid only after all other claimants, including debt holders, are paid. For both of those reasons, as debt increases so does equity risk. Eva knew from the risk/return relationship, as the risk of an investment increases investors demand a higher return. So, as debt increases, equity holders should demand a higher return. The notes on risk and return led Eva back to the Capital Asset Pricing Model (CAPM). In CAPM the risk of a company's stock is measured relative to the risk-free rate the return on Treasury securities) by: 1) beta, which measures the stock's return relative to the market's return (usually the S&P 500), and 2) the market risk premium. Because risk increases as debt increases, CAPM showed Eva that beta will increase as debt increases. Now, Eva is able to compute Napoli's levered beta at various proposed debt levels. For instance, if Napoli raises its level of debt to $200,000, the levered beta would be: Napoli's Beta @ 10% Debt = Unlevered Beta*[1 + (Debt/Equity)*(1 Tax Rate)] = 1.5*(1+$200,000/$1,800,000*(1-.4)] = 1.60 ESTIMATING DEBT RISK PREMIUMS AND INTEREST RATES Eva knew that the risk/return relationship also applied to debt. As debt increases so does the likelihood that the firm will default on the debt, and so does the required return on debt. In the U.S. there are rating agencies that estimate the risk of default and assign ratings to a firm's debt issues. As an example, here is a description of the BBB rating issued by Standard & Poor's: "BBB: An obligor rated 'BBB' has adequate capacity to meet its financial commitments. However, adverse economic conditions or changing circumstances are more likely to lead to a weakened capacity of the obligor to meet its financial commitments.94 Firms with bond ratings, even if their debt it not actively traded, can determine their cost of debt by observing actively traded bonds which match their rating. Also, leverage increases as ratings move from least risky (AAA) to high risk (C). Firms know that increasing their debt will increase their risk. Doing so will lower their bond rating and increase the required yield on their bonds. Eva returned to www.bondsonline.com to find the debt risk premiums associated with different bond ratings (see table below). The debt risk premiums are the average yield for a bond with a given debt rating less the current risk free rate. The seven scenarios will be used to determine (estimate) the optimal debt-to-equity ratio for Napoli Pizza. Seven Scenarios 1 - No debt 2 - 10% debt 3-20% debt 4-30% debt 5-40% debt 6- 50% debt 7- 60% debt Amount Borrowed $0 $200,000 $400,000 $600,000 $800,000 $1,000,000 $1,200,000 Debt Rating BBB BBB BB B CC Debt Risk Premium 0.65% 0.65% 1.75% 2.75% 4.00% 5.00% 6.00% CAPM: Cost of Equity Risk-free Rate + BetaMarket Risk Premium. Long-term Treasury bond rates are most often used as the risk-free rate. The market risk premium is most often measured as the arithmetic average of the difference in returns between long-term Treasures and the S&P 500, about 7%. See Bruner, et al., "Best Practices in Estimating the Cost of Capital: Survey and Synthesis in Financial Practice and Education, pp. 13 - 28. * A description of all ratings can be found on the Standard and Poor's website at: http://www.standardandpoors.com/ratings/criteria/en/us/?filtername-Table of Contents The debt risk premium may be used to calculate the interest rate Napoli would be expected to pay at the various levels of debt. For example: If Napoli were to borrow up to $200,000 its before tax interest rate would be 4.50% +.65% = 5.15% The after tax cost of debt would be (Treasury Bond Rate + Risk Premium) * (1 Tax Rate). (4.50%+.65%) *.40 = 3.09% CALCULATING THE OPTIMUM DEBT-TO-EQUITY RATIO Your task is to determine which of the seven scenarios, above, is the best (optimal) debt- to-equity ratio for Napoli Pizza. You will want to use the information and formulas which Eva Perez has accumulated for you. When you work through the following steps, you will see that this is a relatively straight-forward process. Now, sit down with your favorite pizza (anchovies and onions) and set out to determine the capital structure that will maximize Napoli's stock value. REQUIRED: ESTIMATE AND ANALYZE NAPOLI'S STOCK VALUE What will be the amount of equity after the special dividend under each scenario? (000s) a. 2 3 5 6 7 Scenario Amount Borrowed Equity after Dividend 1 $0 $ $2,000 $ $ $ 4 $ $ S $ S S $ $ b. What will the debt-to-equity ratio (%) be under each scenario? 2 3 4 5 6 7 Scenario Debt/Equity (%) 0 % % % 0% 70 % 04 70 % c. What will be the weights of debt and equity under each scenario? 3 5 6 7 Scenario Weight of Debt Weight of Equity 0.0% 100.0% 2 % % 70 0 4 % % % % % % % % % d. What will be the after-tax cost of debt under each scenario? Cost of Debt = (Treasury Bond Rate + Risk Premium) * (1 - Tax Rate) Scenario After Tax Interest Rate 3.09% 3 % 6 % % % % %Step by Step Solution
There are 3 Steps involved in it
Step: 1

Get Instant Access to Expert-Tailored Solutions
See step-by-step solutions with expert insights and AI powered tools for academic success
Step: 2

Step: 3
Ace Your Homework with AI
Get the answers you need in no time with our AI-driven, step-by-step assistance
Get Started
Faith And Finance
Authors: Jim Palmer
1st Edition
0979635624, 9780979635625