

Answered step by step
Verified Expert Solution
Question
1 Approved Answer
PLEASE EXPLAIN EVERYTHING I want to understand, thank you... R LANGUAGE Question 3 (Data transformation and visualization) We will use Spotify Tracks DB dataset from
PLEASE EXPLAIN EVERYTHING I want to understand, thank you...
R LANGUAGE
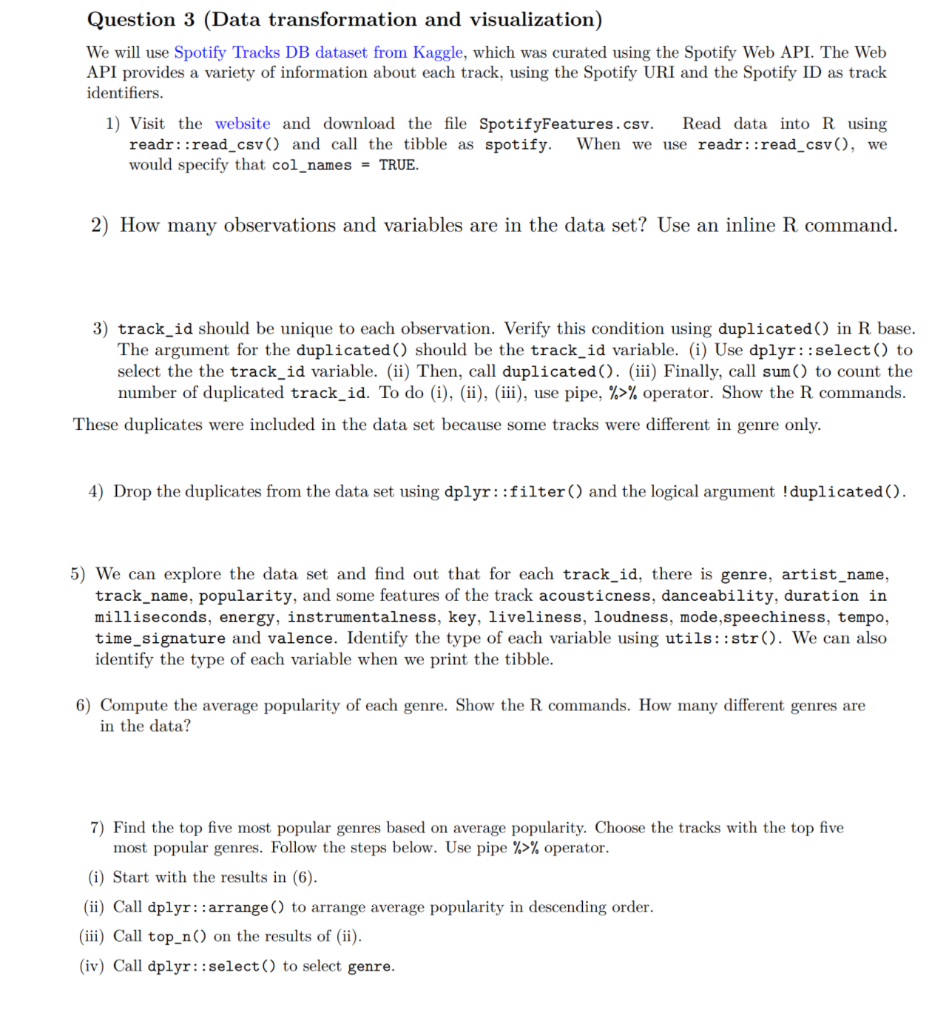
Question 3 (Data transformation and visualization) We will use Spotify Tracks DB dataset from Kaggle, which was curated using the Spotify Web API. The Web API provides a variety of information about each track, using the Spotify URI and the Spotify ID as track identifiers. 1) Visit the website and download the file SpotifyFeatures.csv. Read data into R using readr::read_csv () and call the tibble as spotify. When we use readr::read_csv(), we would specify that col_names = TRUE. 2) How many observations and variables are in the data set? Use an inline R command. 3) track_id should be unique to each observation. Verify this condition using duplicated() in R base. The argument for the duplicated() should be the track_id variable. (i) Use dplyr::select() to select the the track_id variable. (ii) Then, call duplicated(). (iii) Finally, call sum() to count the number of duplicated track_id. To do (i), (ii), (iii), use pipe, %>% operator. Show the R commands. These duplicates were included in the data set because some tracks were different in genre only. 4) Drop the duplicates from the data set using dplyr::filter() and the logical argument ! duplicated(). 5) We can explore the data set and find out that for each track_id, there is genre, artist_name, track_name, popularity, and some features of the track acousticness, danceability, duration in milliseconds, energy, instrumentalness, key, liveliness, loudness, mode, speechiness, tempo, time_signature and valence. Identify the type of each variable using utils::str(). We can also identify the type of each variable when we print the tibble. 6) Compute the average popularity of each genre. Show the R commands. How many different genres are in the data? 7) Find the top five most popular genres based on average popularity. Choose the tracks with the top five most popular genres. Follow the steps below. Use pipe %>% operator. (i) Start with the results in (6). (ii) Call dplyr::arrange() to arrange average popularity in descending order. (iii) Call top_n() on the results of (ii). (iv) Call dplyr::select() to select genre. Question 3 (Data transformation and visualization) We will use Spotify Tracks DB dataset from Kaggle, which was curated using the Spotify Web API. The Web API provides a variety of information about each track, using the Spotify URI and the Spotify ID as track identifiers. 1) Visit the website and download the file SpotifyFeatures.csv. Read data into R using readr::read_csv () and call the tibble as spotify. When we use readr::read_csv(), we would specify that col_names = TRUE. 2) How many observations and variables are in the data set? Use an inline R command. 3) track_id should be unique to each observation. Verify this condition using duplicated() in R base. The argument for the duplicated() should be the track_id variable. (i) Use dplyr::select() to select the the track_id variable. (ii) Then, call duplicated(). (iii) Finally, call sum() to count the number of duplicated track_id. To do (i), (ii), (iii), use pipe, %>% operator. Show the R commands. These duplicates were included in the data set because some tracks were different in genre only. 4) Drop the duplicates from the data set using dplyr::filter() and the logical argument ! duplicated(). 5) We can explore the data set and find out that for each track_id, there is genre, artist_name, track_name, popularity, and some features of the track acousticness, danceability, duration in milliseconds, energy, instrumentalness, key, liveliness, loudness, mode, speechiness, tempo, time_signature and valence. Identify the type of each variable using utils::str(). We can also identify the type of each variable when we print the tibble. 6) Compute the average popularity of each genre. Show the R commands. How many different genres are in the data? 7) Find the top five most popular genres based on average popularity. Choose the tracks with the top five most popular genres. Follow the steps below. Use pipe %>% operator. (i) Start with the results in (6). (ii) Call dplyr::arrange() to arrange average popularity in descending order. (iii) Call top_n() on the results of (ii). (iv) Call dplyr::select() to select genreStep by Step Solution
There are 3 Steps involved in it
Step: 1

Get Instant Access to Expert-Tailored Solutions
See step-by-step solutions with expert insights and AI powered tools for academic success
Step: 2

Step: 3
Ace Your Homework with AI
Get the answers you need in no time with our AI-driven, step-by-step assistance
Get Started
Advances In Database Technology Edbt 94 4th International Conference On Extending Database Technology Cambridge United Kingdom March 1994 Proceedings Lncs 779
Authors: Matthias Jarke ,Janis Bubenko ,Keith Jeffery
1994th Edition
3540578188, 978-3540578185