

Question
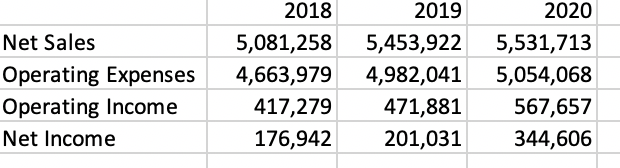
Please explain how can I make a trend analysis for 3-year on the data shown below in excel. Note: 2018 needs to be the base
Please explain how can I make a trend analysis for 3-year on the data shown below in excel. Note: 2018 needs to be the base year. Please explain the results if possible.
Step by Step Solution
There are 3 Steps involved in it
Step: 1

Get Instant Access to Expert-Tailored Solutions
See step-by-step solutions with expert insights and AI powered tools for academic success
Step: 2

Step: 3
Ace Your Homework with AI
Get the answers you need in no time with our AI-driven, step-by-step assistance
Get Started
Cornerstones of Financial and Managerial Accounting
Authors: Rich Jones, Mowen, Hansen, Heitger
1st Edition
9780538751292, 324787359, 538751290, 978-0324787351