 Please explain how to create accounting and break even analysis using Goal Seek in excel
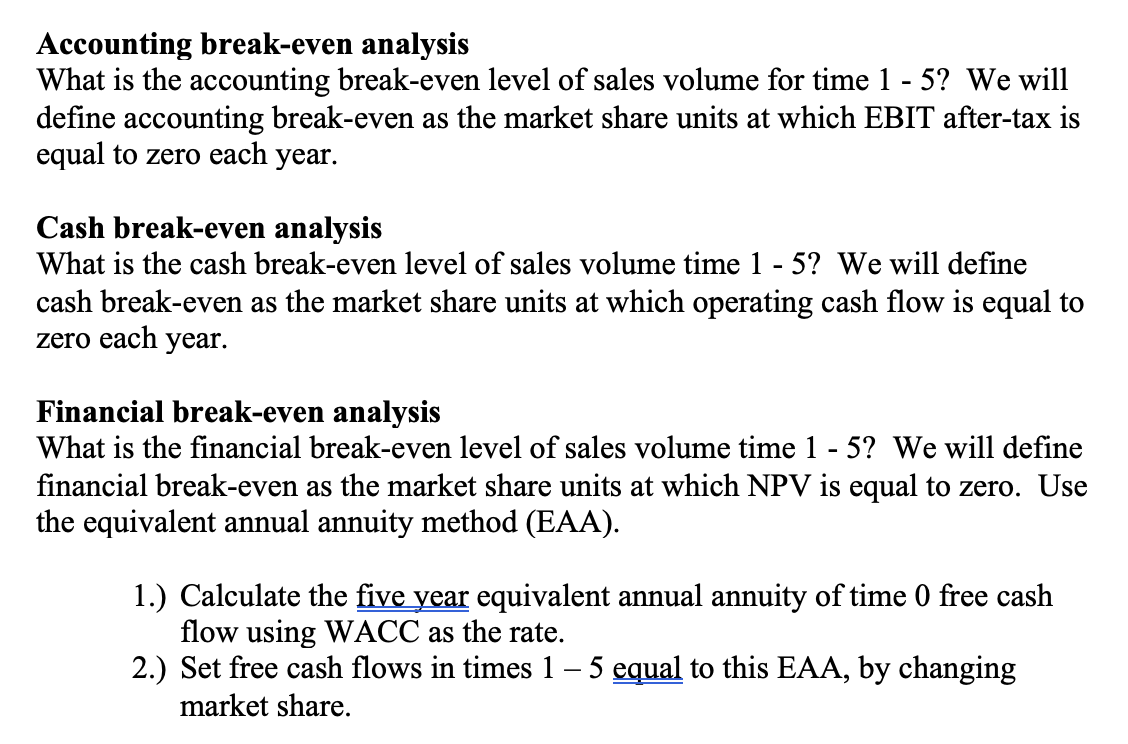
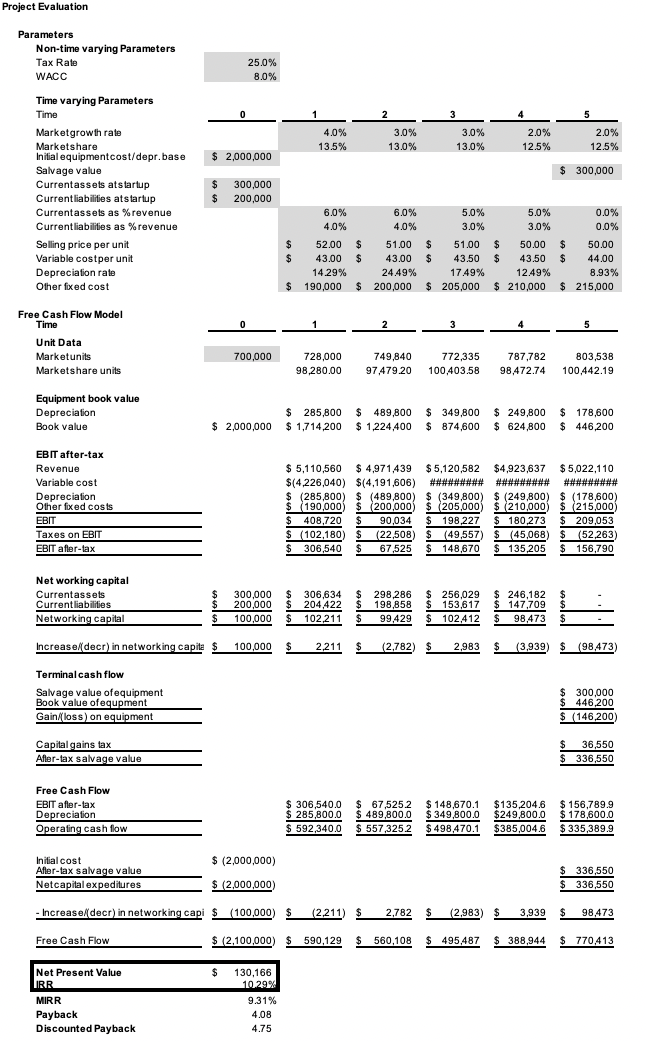
Accounting break-even analysis What is the accounting break-even level of sales volume for time 1 - 5? We will 1 define accounting break-even as the market share units at which EBIT after-tax is equal to zero each year. Cash break-even analysis What is the cash break-even level of sales volume time 1 - 5? We will define cash break-even as the market share units at which operating cash flow is equal to zero each year. Financial break-even analysis What is the financial break-even level of sales volume time 1 - 5? We will define financial break-even as the market share units at which NPV is equal to zero. Use the equivalent annual annuity method (EAA). 1.) Calculate the five year equivalent annual annuity of time 0 free cash flow using WACC as the rate. 2.) Set free cash flows in times 1 5 equal to this EAA, by changing market share. Project Evaluation Parameters Non-time varying Parameters Tax Rate WACC 25.0% 8.0% 0 2 3 5 4.0% 13.5% 3.0% 13.0% 3.0% 13.0% 2.0% 12.5% 2.0% 12.5% $ 2,000,000 $ 300,000 Time varying Parameters Time Marketgrowth rate Marketshare Initial equipmentcost/depr. base . Salvage value Currentassets atstartup Current liabilities atstartup Currentassets as %revenue Current liabilities as % revenue Selling price per unit Variable costper unit Depreciation rate Other fixed cost $ $ 300,000 200,000 6.0% 6.0% 4.0% 4.0% $ $ 52.00 $ 51.00 $ 43.00 $ $ 43.00 1429% 24.49% $ 190,000 $ 200,000 5.0% 3.0% $ 51.00 $ 43.50 17.49% $ 205,000 5.0% 0.0% 3.0% 0.0% $ 50.00 $ 50.00 $ 43.50 $ 44.00 12.49% 8.93% $ 210,000 $ 215,000 0 1 2 3 4 5 Free Cash Flow Model Time Unit Data Marketunits Marketshare units 700,000 728,000 98,280.00 749,840 97,479.20 772,335 100,403.58 787,782 98,472.74 803,538 100,442.19 Equipment book value Depreciation Book value $ 249,800 $ 285,800 $ 2,000,000 $1,714,200 $ 489,800 $ 1,224,400 $ 349,800 $ 874,600 $ 624,800 $ 178,600 $ 446,200 EBIT after-tax Revenue Variable cost Depreciation Other fixed costs EBIT Taxes on EBIT EBIT after-tax $ 5,110,560 $ $ 4,971,439 $5,120,582 $ $4,923,637 $5,022,110 $(4,226,040) $(4,191,606) ################## $ (285,800) $ (489,800 $ (349,800) $ (249,800) $ (249,800) $ (178,600 $ ) $ 190,000 $ 200,000 $ 205,000 () $ 200,000) $ 205,000) $ 210,000) $ (215,000 $ 408,720 $ 90,034 $ 198,227 $ 180,273 $ 209,053 $ (102,180) $ (22,508) $ (49,557) $ (45,068) $ (52.263) $ 306,540 $ 67,525 $ 148,670 $ 135,205 $ 156,790 $ Net working capital Currentassets Current liabilities Networking capital 300,000 200,000 100,000 $ $ $ 306,634 204.422 102.211 $ $ 298,286 $ 198,858 $ 99,429 $ 256,029 $ 153,617 $ 102,412 $ 246,182 $ 147,709 $ 98.473 $ $ Increase decr) in networking capita /$ 100,000 $ 2.211 (2,782 $ 2,983 $ (3,939) $ (98,473 ( ) Terminal cash flow Salvage value of equipment Book value ofequpment Gain/loss) on equipment $ 300,000 $ 446,200 $ (146,200 Capital gains tax After-tax salvage value 36,550 $ 336,550 Free Cash Flow EBIT after-tax Depreciation Operating cash flow $ 306,540.0 $ 285,800.0 $ 592,340.0 $ 67,525.2 $ 489,800.0 $ 557,325.2 $ 148,670.1 $ 349,800.0 $ 498,470.1 $135,204.6 $249,8000 $385,004.6 $ 156,789.9 $ 178,600.0 $335,389.9 $ 2,000,000) Initial cost Afler-tax salvage value Netcapital expeditures $ 336,550 $ 336,550 $ 2,000,000 - Increase/ decr) in networking capi $ (100,000) $ (2211) ($ 2.782 $ $ (2,983) $ 3,939 $ 98,473 Free Cash Flow $ (2,100,000) $590,129 $ 560,108 $ $ $ 495,487 $ 388,944 $ 770,413 Net Present Value $ IRR MIRR Payback Discounted Payback 130,166 10.29% 9.31% 4.08 4.75 Accounting break-even analysis What is the accounting break-even level of sales volume for time 1 - 5? We will 1 define accounting break-even as the market share units at which EBIT after-tax is equal to zero each year. Cash break-even analysis What is the cash break-even level of sales volume time 1 - 5? We will define cash break-even as the market share units at which operating cash flow is equal to zero each year. Financial break-even analysis What is the financial break-even level of sales volume time 1 - 5? We will define financial break-even as the market share units at which NPV is equal to zero. Use the equivalent annual annuity method (EAA). 1.) Calculate the five year equivalent annual annuity of time 0 free cash flow using WACC as the rate. 2.) Set free cash flows in times 1 5 equal to this EAA, by changing market share. Project Evaluation Parameters Non-time varying Parameters Tax Rate WACC 25.0% 8.0% 0 2 3 5 4.0% 13.5% 3.0% 13.0% 3.0% 13.0% 2.0% 12.5% 2.0% 12.5% $ 2,000,000 $ 300,000 Time varying Parameters Time Marketgrowth rate Marketshare Initial equipmentcost/depr. base . Salvage value Currentassets atstartup Current liabilities atstartup Currentassets as %revenue Current liabilities as % revenue Selling price per unit Variable costper unit Depreciation rate Other fixed cost $ $ 300,000 200,000 6.0% 6.0% 4.0% 4.0% $ $ 52.00 $ 51.00 $ 43.00 $ $ 43.00 1429% 24.49% $ 190,000 $ 200,000 5.0% 3.0% $ 51.00 $ 43.50 17.49% $ 205,000 5.0% 0.0% 3.0% 0.0% $ 50.00 $ 50.00 $ 43.50 $ 44.00 12.49% 8.93% $ 210,000 $ 215,000 0 1 2 3 4 5 Free Cash Flow Model Time Unit Data Marketunits Marketshare units 700,000 728,000 98,280.00 749,840 97,479.20 772,335 100,403.58 787,782 98,472.74 803,538 100,442.19 Equipment book value Depreciation Book value $ 249,800 $ 285,800 $ 2,000,000 $1,714,200 $ 489,800 $ 1,224,400 $ 349,800 $ 874,600 $ 624,800 $ 178,600 $ 446,200 EBIT after-tax Revenue Variable cost Depreciation Other fixed costs EBIT Taxes on EBIT EBIT after-tax $ 5,110,560 $ $ 4,971,439 $5,120,582 $ $4,923,637 $5,022,110 $(4,226,040) $(4,191,606) ################## $ (285,800) $ (489,800 $ (349,800) $ (249,800) $ (249,800) $ (178,600 $ ) $ 190,000 $ 200,000 $ 205,000 () $ 200,000) $ 205,000) $ 210,000) $ (215,000 $ 408,720 $ 90,034 $ 198,227 $ 180,273 $ 209,053 $ (102,180) $ (22,508) $ (49,557) $ (45,068) $ (52.263) $ 306,540 $ 67,525 $ 148,670 $ 135,205 $ 156,790 $ Net working capital Currentassets Current liabilities Networking capital 300,000 200,000 100,000 $ $ $ 306,634 204.422 102.211 $ $ 298,286 $ 198,858 $ 99,429 $ 256,029 $ 153,617 $ 102,412 $ 246,182 $ 147,709 $ 98.473 $ $ Increase decr) in networking capita /$ 100,000 $ 2.211 (2,782 $ 2,983 $ (3,939) $ (98,473 ( ) Terminal cash flow Salvage value of equipment Book value ofequpment Gain/loss) on equipment $ 300,000 $ 446,200 $ (146,200 Capital gains tax After-tax salvage value 36,550 $ 336,550 Free Cash Flow EBIT after-tax Depreciation Operating cash flow $ 306,540.0 $ 285,800.0 $ 592,340.0 $ 67,525.2 $ 489,800.0 $ 557,325.2 $ 148,670.1 $ 349,800.0 $ 498,470.1 $135,204.6 $249,8000 $385,004.6 $ 156,789.9 $ 178,600.0 $335,389.9 $ 2,000,000) Initial cost Afler-tax salvage value Netcapital expeditures $ 336,550 $ 336,550 $ 2,000,000 - Increase/ decr) in networking capi $ (100,000) $ (2211) ($ 2.782 $ $ (2,983) $ 3,939 $ 98,473 Free Cash Flow $ (2,100,000) $590,129 $ 560,108 $ $ $ 495,487 $ 388,944 $ 770,413 Net Present Value $ IRR MIRR Payback Discounted Payback 130,166 10.29% 9.31% 4.08 4.75

 Please explain how to create accounting and break even analysis using Goal Seek in excel


