Answered step by step
Verified Expert Solution
Question
1 Approved Answer
please explain if possible! thank you! eBook Measures of liquidity, Solvency and Profitability The comparative financial statements of Stargel Inc. are as follows. The market
please explain if possible! thank you! 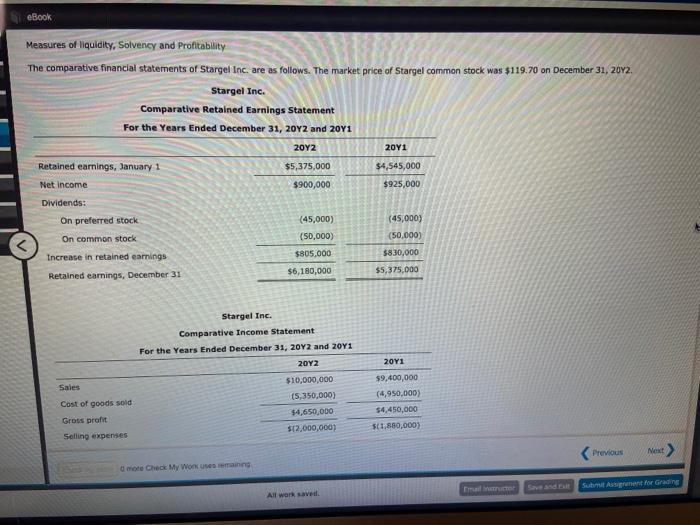
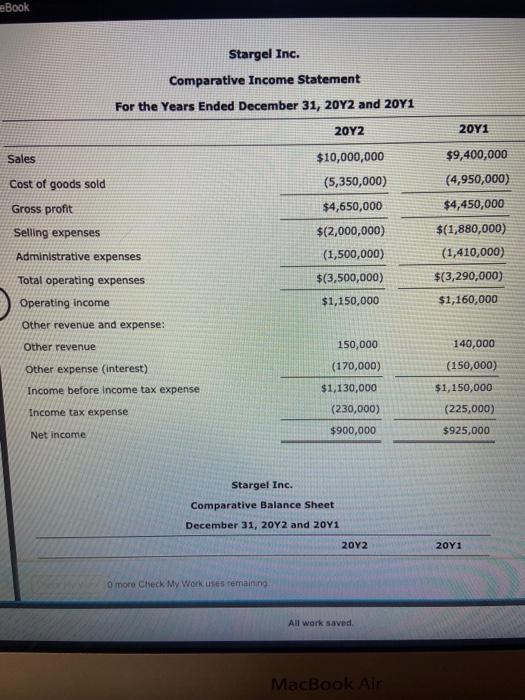
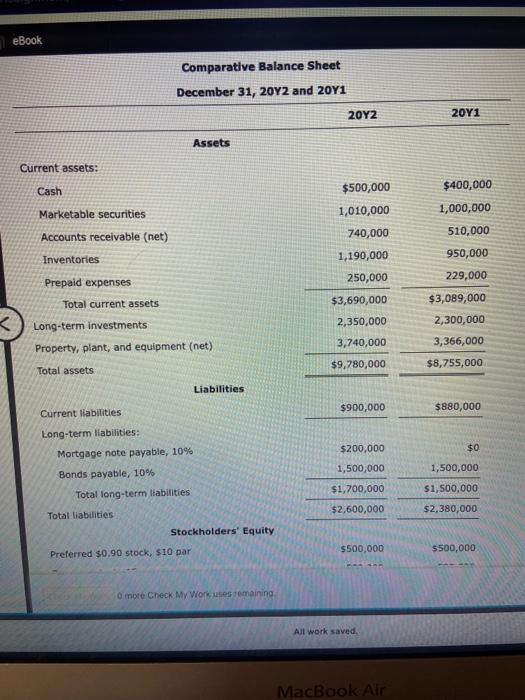
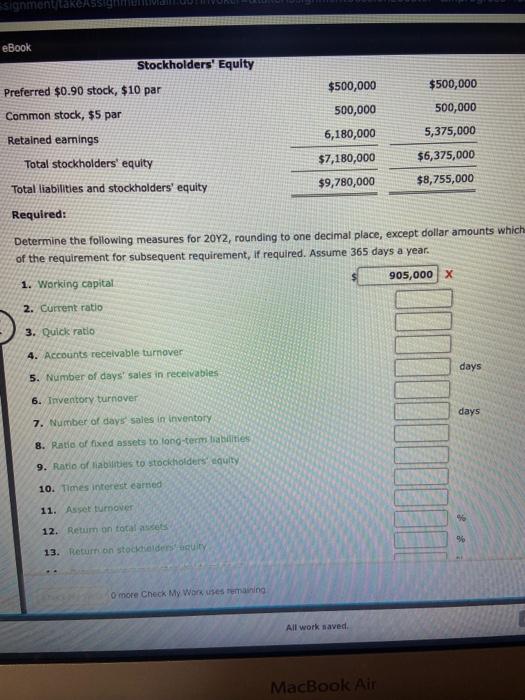
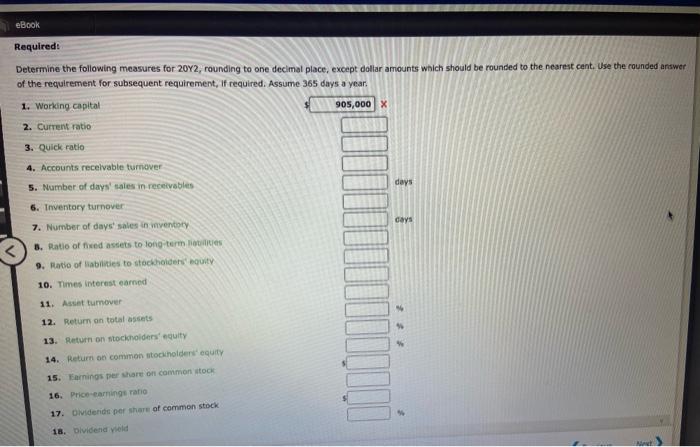
eBook Measures of liquidity, Solvency and Profitability The comparative financial statements of Stargel Inc. are as follows. The market price of Stargel common stock was $119.70 on December 31, 2012. Stargel Inc. Comparative Retained Earnings Statement For the Years Ended December 31, 2012 and 2011 2012 2011 Retained earnings, January 1 $4,545,000 $5,375,000 $900,000 Net Income $925,000 Dividends: On preferred stock On common stock (45,000) (50,000) (45,000) (50,000) $805,000 $6,180,000 Increase in retained earnings $830,000 $5,375,000 Retained earnings, December 31 Stargel Inc. Comparative Income Statement For the Years Ended December 31, 2012 and 2011 2012 2011 Sales Cost of goods sold Grous profit $10,000,000 (5,350,000) $4,650,000 $12,000,000) $9,400,000 (4,950,000) $4,450,000 $(1,850,000) Selling expenses Previous Next Om Check My Wong Save Sussirenent for Grading All work save eBook Stargel Inc. Comparative Income Statement For the Years Ended December 31, 20Y2 and 2011 20Y2 20Y1 Sales Cost of goods sold Gross profit Selling expenses Administrative expenses Total operating expenses Operating income Other revenue and expense: $10,000,000 (5,350,000) $4,650,000 $(2,000,000) (1,500,000) $(3,500,000) $9,400,000 (4,950,000) $4,450,000 $(1,880,000) (1,410,000) $(3,290,000) $1,160,000 $1,150,000 Other revenue 140,000 (150,000) Other expense interest) 150,000 (170,000) $1,130,000 (230,000) Income before income tax expense $1,150,000 Income tax expense (225,000) Net income $900,000 $925,000 Stargel Inc. Comparative Balance Sheet December 31, 20Y2 and 2041 2012 20Y1 O moro Check My Work uses remaining All work saved MacBook Air eBook Comparative Balance Sheet December 31, 2012 and 2011 2012 2011 Assets Current assets: Cash Marketable securities Accounts receivable (net) Inventories $500,000 1,010,000 740,000 1,190,000 250,000 $3,690,000 2,350,000 $400,000 1,000,000 510,000 950,000 229,000 $3,089,000 2,300,000 3,366,000 


Step by Step Solution
There are 3 Steps involved in it
Step: 1

Get Instant Access to Expert-Tailored Solutions
See step-by-step solutions with expert insights and AI powered tools for academic success
Step: 2

Step: 3

Ace Your Homework with AI
Get the answers you need in no time with our AI-driven, step-by-step assistance
Get Started


