Please explain in detail and show clear workings for better understanding thank you.
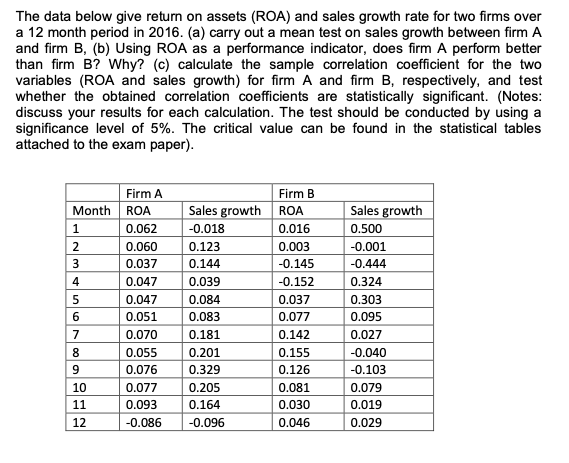
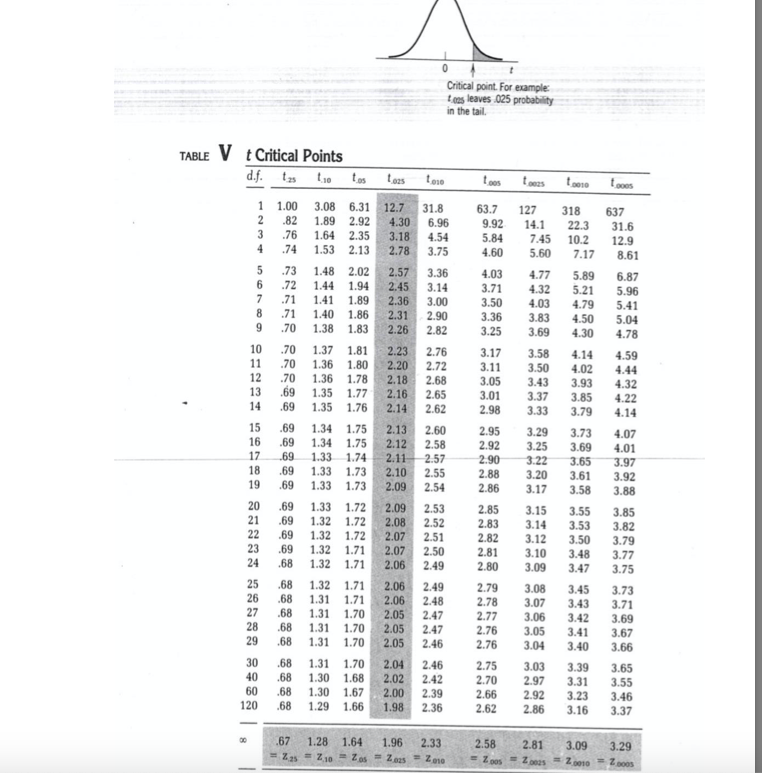
The data below give return on assets (ROA) and sales growth rate for two firms over a 12 month period in 2016. (a) carry out a mean test on sales growth between firm A and firm B, (b) Using ROA as a performance indicator, does firm A perform better than firm B? Why? (c) calculate the sample correlation coefficient for the two variables (ROA and sales growth) for firm A and firm B, respectively, and test whether the obtained correlation coefficients are statistically significant. (Notes: discuss your results for each calculation. The test should be conducted by using a significance level of 5%. The critical value can be found in the statistical tables attached to the exam paper). Firm A Firm B Month ROA Sales growth ROA Sales growth 1 0.062 -0.018 0.016 0.500 2 0.060 0.123 0.003 -0.001 3 0.037 0.144 -0.145 -0.444 A 0.047 0.039 -0.152 0.324 5 0.047 0.084 0.037 0.303 6 0.051 0.083 0.077 0.095 7 0.070 0.181 0.142 0.027 8 0.055 0.201 0.155 -0.040 9 0.076 0.329 0.126 -0.103 10 0.077 0.205 0.081 0.079 11 0.093 0.164 0.030 0.019 12 -0.086 -0.096 0.046 0.029Critical point. For example omg leaves .025 probability in the tail. TABLE V t Critical Points d.f. t.as t.as Loos ,ones 1.00 3.08 6.31 12.7 31.8 63.7 127 318 637 .82 1.89 2.92 4.30 6.96 9.92 14.1 22.3 31.6 AUNE 76 1.64 2.35 3.18 4.54 5.84 7.45 10.2 12.9 74 1.53 2.13 2.78 3.75 4.60 5.60 7.17 8.61 .73 1.48 2.02 2.57 3.36 4.03 4.77 5.89 6.87 .72 1.44 1.94 2.45 3.14 3.71 4.32 5.21 5.96 .71 1.41 1.89 2.36 3.00 3.50 4.03 4.79 5.41 .71 1.40 1.86 2.31 2.90 3.36 3.83 4.50 5.04 .70 1.38 1.83 2.26 2.82 3.25 3.69 4.30 4.78 4.14 4.59 10 .70 1.37 1.81 2.23 2.76 3.17 3.58 .70 1.36 1.80 2.20 2.72 3.11 3.50 4.02 4.44 .70 1.36 1.78 2.18 2.68 3.05 3.43 3.93 4.32 .69 1.35 2.16 2.65 3.01 3.37 3.85 4.22 .69 1.35 1.76 2.14 2.62 2.98 3.33 3.79 4.14 .69 1.34 1.75 2.13 2.60 2.95 3.29 3.73 4.07 .69 1.34 1.75 2.12 2.58 2.92 3.25 3.69 4.01 .69 1.33 1.74 2.11 2.57 2.90 3.22 3.65 3.97 1.33 1.73 3.20 3.61 3.92 .69 2.10 2.55 2.88 .69 1.33 1.73 2.09 2.54 2.86 3.17 3.58 3.88 1.33 1.72 2.09 2.53 2.85 3.15 3.55 3.85 20 .69 21 .69 1.32 1.72 2.08 2.52 2.83 3.14 3.53 3.82 22 .69 1.32 1.72 2.07 2.51 2.82 3.12 3.50 3.79 23 .69 1.32 1.71 2.07 2.50 2.81 3.10 3.48 3.77 24 .68 1.32 1.71 2.06 2.49 2.80 3.09 3.47 3.75 .68 1.32 1.71 2.06 2.49 2.79 3.08 3.45 3.73 25 26 .68 1.31 1.71 2.06 2.48 2.78 3.07 3.43 3.71 27 .68 1.31 1.70 2.05 2.47 2.77 3.06 3.42 3.69 28 1.31 1.70 2.05 2.47 2.76 3.05 3.41 3.67 .68 29 .68 1.31 1.70 2.05 2.46 2.76 3.04 3.40 3.66 30 .68 1.31 1.70 2.04 2.46 2.75 3.03 3.39 3.65 1.30 1.68 2.02 2.42 2.70 2.97 3.31 3.55 40 .68 3.46 60 .68 1.30 1.67 2.00 2.39 2.66 2.92 3.23 68 1.29 1.66 1.98 2.36 2.62 1.86 3.16 3.37 120 .67 1.28 1.64 1.96 2.33 2.58 2.81 3.09 3.29 = 235 - 210 = Zas = Zmas = Zoo = 2 00s = 20091 = 2,0010 = Zoo03