Answered step by step
Verified Expert Solution
Question
1 Approved Answer
Please explain in detail, as I'm so confused about how to form the graph and compare the complexity Consider the following functions in terms of
Please explain in detail, as I'm so confused about how to form the graph and compare the complexity
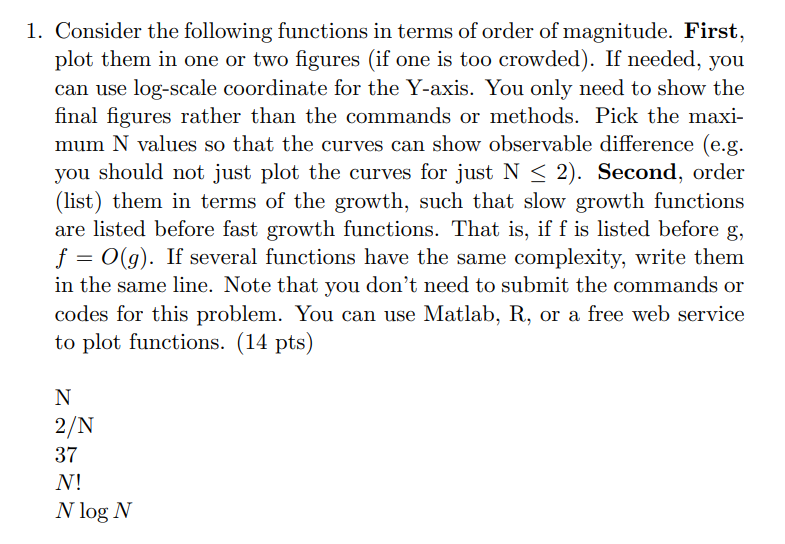
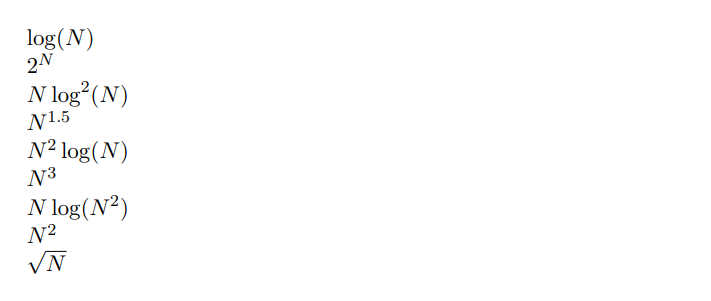
Consider the following functions in terms of order of magnitude. First, plot them in one or two figures (if one is too crowded). If needed, you can use log-scale coordinate for the Y-axis. You only need to show the final figures rather than the commands or methods. Pick the maximum N values so that the curves can show observable difference (e.g. you should not just plot the curves for just N2 ). Second, order (list) them in terms of the growth, such that slow growth functions are listed before fast growth functions. That is, if f is listed before g, f=O(g). If several functions have the same complexity, write them in the same line. Note that you don't need to submit the commands or codes for this problem. You can use Matlab, R, or a free web service to plot functions. (14 pts) log(N) 2N Nlog2(N) N1.5 N2log(N) N3 Nlog(N2) N2 N
Step by Step Solution
There are 3 Steps involved in it
Step: 1
Get Instant Access to Expert-Tailored Solutions
See step-by-step solutions with expert insights and AI powered tools for academic success
Step: 2
Step: 3
Ace Your Homework with AI
Get the answers you need in no time with our AI-driven, step-by-step assistance
Get Started