Answered step by step
Verified Expert Solution
Link Copied!

Question

1 Approved Answer

PLEASE EXPLAIN Price 350 Supply 300 + 250 200 150 100 + 50 50 100 150 200 Quextity Consider the market shown in the graph

image text in transcribedPLEASE EXPLAIN

Price 350 Supply 300 + 250 200 150 100 + 50 50 100 150 200 Quextity Consider the market shown in the graph above. If the equilibrium price rises from $200 to $350, what is the additional producer surplus to initial producers? $30,000 $15,000 $7,500 $3,750

Step by Step Solution

There are 3 Steps involved in it

Step: 1

blur-text-image

Get Instant Access to Expert-Tailored Solutions

See step-by-step solutions with expert insights and AI powered tools for academic success

Step: 2

blur-text-image_2

Step: 3

blur-text-image_3

Ace Your Homework with AI

Get the answers you need in no time with our AI-driven, step-by-step assistance

Get Started

Recommended Textbook for

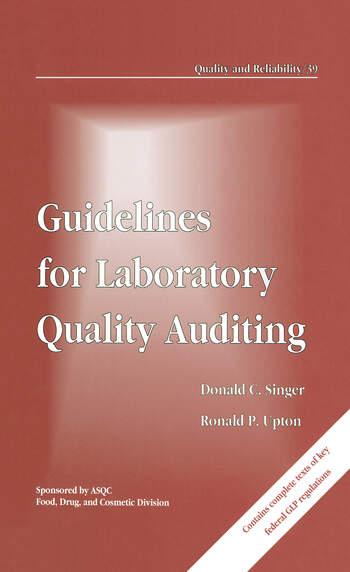
Guidelines For Laboratory Quality Auditing

Authors: Donald C. Singer, Ronald P. Upton

1st Edition

0824787846, 978-0824787844

More Books

Students also viewed these Accounting questions

Question

Give a brief defi ni tion of the terms population and sample.

Answered: 1 week ago

Question

2. What is the meaning and definition of Banking?

Answered: 1 week ago

Question

3.What are the Importance / Role of Bank in Business?

Answered: 1 week ago