please explain
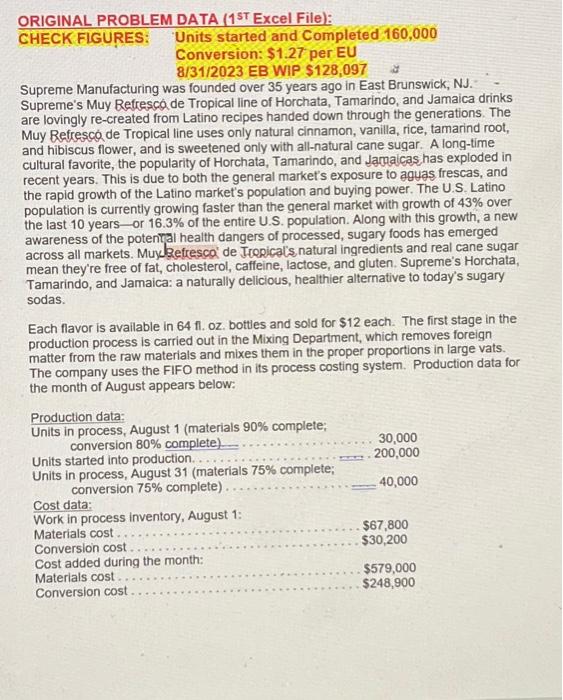
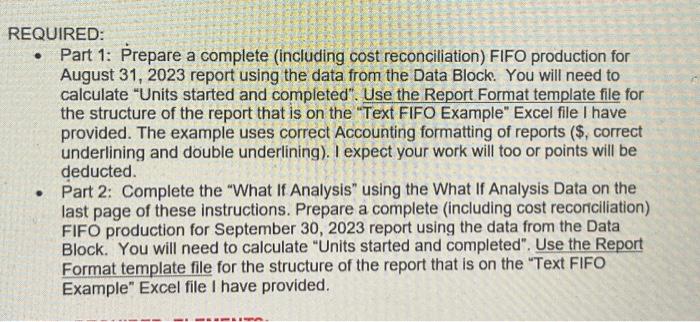
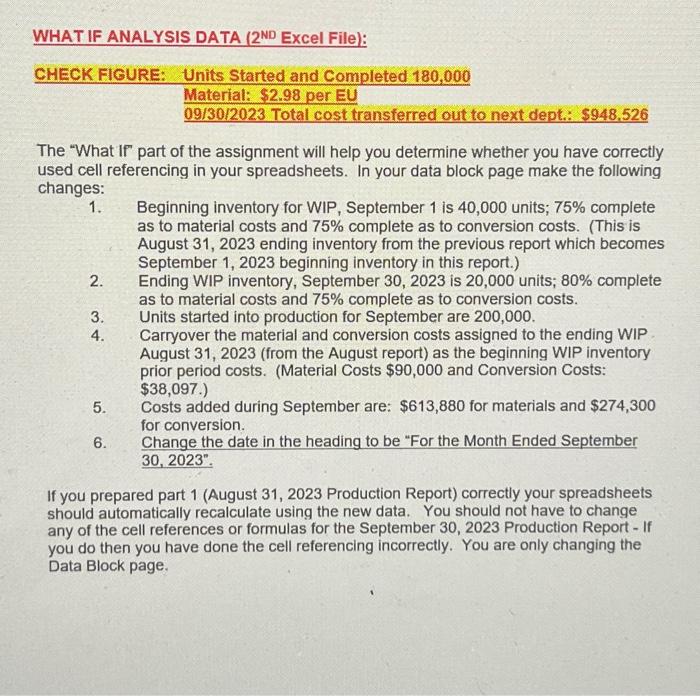
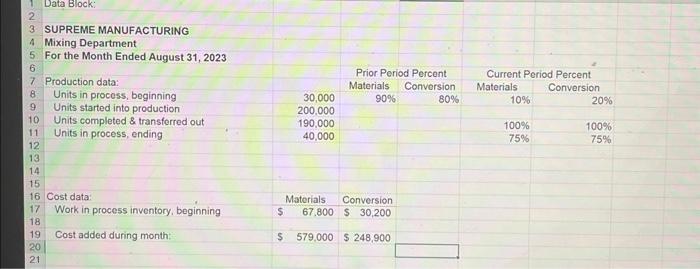
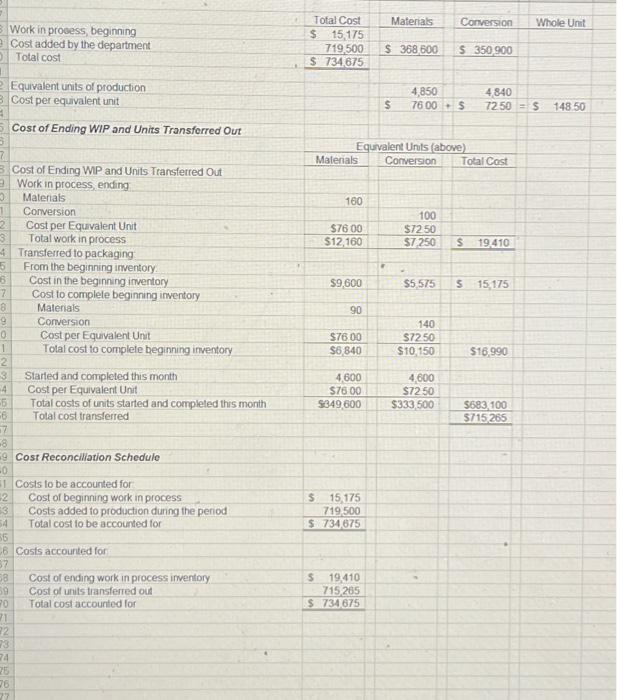
REQUIRED: - Part 1: Prepare a complete (including cost reconciliation) FIFO production for August 31, 2023 report using the data from the Data Block. You will need to calculate "Units started and completed". Use the Report Format template file for the structure of the report that is on the "Text FIFO Example" Excel file I have provided. The example uses correct Accounting formatting of reports ($, correct underlining and double underlining). I expect your work will too or points will be deducted. - Part 2: Complete the "What If Analysis" using the What If Analysis Data on the last page of these instructions. Prepare a complete (including cost reconciliation) FIFO production for September 30, 2023 report using the data from the Data Block. You will need to calculate "Units started and completed". Use the Report Format template file for the structure of the report that is on the "Text FIFO Example" Excel file I have provided. Data Block: 3 SUPREME MANUFACTURING 4 Mixing Department 5. For the Month Ended August 31, 2023 6 7 Production data: 8. Units in procoss, beginning 9 Units started into production 10 Units completed \& transferred out 11 Units in process, ending \begin{tabular}{|c|c|c|c|c|} \hline & & & \multirow{2}{*}{\multicolumn{2}{|c|}{4}} \\ \hline & \multicolumn{2}{|c|}{ Prior Period Percent } & & Current Period Percent \\ \hline & Materials & Conversion & Materials & Conversion \\ \hline 30,000 & 90% & 80% & 10% & 20% \\ \hline 200.000 & & & & \\ \hline 190,000 & & & 100% & 100% \\ \hline 40,000 & & & 75% & 75% \\ \hline \end{tabular} 12 13 14 15 15 16 Cost data: 17 Work in process inventory, beginning 18 19 Cost added during month: \begin{tabular}{ccc} Materials & Conversion \\ \hline$67.800 & $30,200 \end{tabular} 20 21 \$ 579,000$248,900 CHECK FIGURE: Units Started and Completed 180,000 Material: $2.98 per EU 09/30/2023 Total cost transferred out to next dept.: $948.526 The "What If" part of the assignment will help you determine whether you have correctly used cell referencing in your spreadsheets. In your data block page make the following changes: 1. Beginning inventory for WIP, September 1 is 40,000 units; 75% complete as to material costs and 75% complete as to conversion costs. (This is August 31, 2023 ending inventory from the previous report which becomes September 1, 2023 beginning inventory in this report.) 2. Ending WIP inventory, September 30,2023 is 20,000 units; 80% complete as to material costs and 75% complete as to conversion costs. 3. Units started into production for September are 200,000 . 4. Carryover the material and conversion costs assigned to the ending WIP August 31, 2023 (from the August report) as the beginning WIP inventory prior period costs. (Material Costs $90,000 and Conversion Costs: $38,097.) 5. Costs added during September are: $613,880 for materials and $274,300 for conversion. 6. Change the date in the heading to be "For the Month Ended September 30, 2023". If you prepared part 1 (August 31, 2023 Production Report) correctly your spreadsheets should automatically recalculate using the new data. You should not have to change any of the cell references or formulas for the September 30, 2023 Production Report - If you do then you have done the cell referencing incorrectly. You are only changing the Data Block page. ORIGINAL PROBLEM DATA ( 1ST Excel File): CHECK FIGURES: Units started and Completed 160,000 Conversion: $1.27 per EU 8/31/2023 EB WIP $128,097 is Supreme Manufacturing was founded over 35 years ago in East Brunswick, NJ. Supreme's Muy Refresc de Tropical line of Horchata, Tamarindo, and Jamaica drinks are lovingly re-created from Latino recipes handed down through the generations. The Muy Refresc de Tropical line uses only natural cinnamon, vanilla, rice, tamarind root, and hibiscus flower, and is sweetened only with all-natural cane sugar. A long-time cultural favorite, the popularity of Horchata, Tamarindo, and Jamaicas, has exploded in recent years. This is due to both the general market's exposure to aquas frescas, and the rapid growth of the Latino market's population and buying power. The U.S. Latino population is currently growing faster than the general market with growth of 43% over the last 10 years - or 16.3% of the entire U.S. population. Along with this growth, a new awareness of the potenral health dangers of processed, sugary foods has emerged across all markets. Muyl 3 efresco' de Jrepical's, natural ingredients and real cane sugar mean they're free of fat, cholesterol, caffeine, lactose, and gluten. Supreme's Horchata, Tamarindo, and Jamaica: a naturally delicious, healthier alternative to today's sugary sodas. Each flavor is available in 64fl. oz. bottles and sold for $12 each. The first stage in the production process is carried out in the Mixing Department, which removes foreign matter from the raw materials and mixes them in the proper proportions in large vats. The company uses the FIFO method in its process costing system. Production data for the month of August appears below: Production data: Units in process, August 1 (materials 90% complete; conversion 80% complete) 30,000 Units started into production. 200,000 Units in process, August 31 (materials 75% complete; conversion 75% complete) 40,000 Cost data: Work in process inventory, August 1: Materials cost $67,800 Conversion cost $30,200 Cost added during the month: Materlals cost $579,000 Conversion cost $248,900 Work in prosess, beginning Cost added by the department Total cost Equivalent units of production Cost per equivalent unit Cost of Ending WIP and Units Transforred Out Cost of Ending WP and Units Transferred Out Work in process, ending Materials Corversion Cost per Equivalent Unit Total work in process Transterred to packaging From the beginning inventory. Cost in the beginning imventory Cost to complete beginning inventory Materials Conversion Cost per Equivalent Unit Total cost to complele beginning inventory Slarted and completed this month Cost per Equivalent Unit Total costs of units started and compleled this month Tolal cost transterred Total Cost Materials Conversion Whole Unit \$ 15,175 . \begin{tabular}{|r|r|r|} 719,500 & S 368,600 & S 350,900 \\ \hline 5734,675 & \end{tabular} 4,850$7600+$72840 Equvalent Units (above) \begin{tabular}{|c|c|c|} \hline Materials & Corversion & Total Cost \\ \hline & & \\ \hline & & \\ \hline \multicolumn{3}{|l|}{160} \\ \hline & 100 & \\ \hline$7600 & $7250 & \\ \hline \multirow[t]{3}{*}{$12,160} & $7,250 & S 19410 \\ \hline & & \\ \hline & 0 & \\ \hline$9,600 & $5,575 & S 15,175 \\ \hline \multicolumn{3}{|l|}{90} \\ \hline & 140 & \\ \hline$7600 & $7250 & \\ \hline$6,840 & $10,150 & $16,990 \\ \hline 4,600 & 4,600 & \\ \hline$7600 & $7250 & \\ \hline \multirow[t]{2}{*}{$349,600} & $333,500 & $683,100 \\ \hline & & 5715,265 \\ \hline \end{tabular} Cost Reconcillation Schedule Costs to be accounted for Cost of beginning work in process Costs added to production duning the period Total cost to be accounted for Costs accounted for Cost of ending work in process inventory Cost of units transferred out S 15,175 \begin{tabular}{rr} 719,500 \\ \hline 5.734,875 \\ \hline \end{tabular} Total cost accounted for S 19,410 715.2655734675 REQUIRED: - Part 1: Prepare a complete (including cost reconciliation) FIFO production for August 31, 2023 report using the data from the Data Block. You will need to calculate "Units started and completed". Use the Report Format template file for the structure of the report that is on the "Text FIFO Example" Excel file I have provided. The example uses correct Accounting formatting of reports ($, correct underlining and double underlining). I expect your work will too or points will be deducted. - Part 2: Complete the "What If Analysis" using the What If Analysis Data on the last page of these instructions. Prepare a complete (including cost reconciliation) FIFO production for September 30, 2023 report using the data from the Data Block. You will need to calculate "Units started and completed". Use the Report Format template file for the structure of the report that is on the "Text FIFO Example" Excel file I have provided. Data Block: 3 SUPREME MANUFACTURING 4 Mixing Department 5. For the Month Ended August 31, 2023 6 7 Production data: 8. Units in procoss, beginning 9 Units started into production 10 Units completed \& transferred out 11 Units in process, ending \begin{tabular}{|c|c|c|c|c|} \hline & & & \multirow{2}{*}{\multicolumn{2}{|c|}{4}} \\ \hline & \multicolumn{2}{|c|}{ Prior Period Percent } & & Current Period Percent \\ \hline & Materials & Conversion & Materials & Conversion \\ \hline 30,000 & 90% & 80% & 10% & 20% \\ \hline 200.000 & & & & \\ \hline 190,000 & & & 100% & 100% \\ \hline 40,000 & & & 75% & 75% \\ \hline \end{tabular} 12 13 14 15 15 16 Cost data: 17 Work in process inventory, beginning 18 19 Cost added during month: \begin{tabular}{ccc} Materials & Conversion \\ \hline$67.800 & $30,200 \end{tabular} 20 21 \$ 579,000$248,900 CHECK FIGURE: Units Started and Completed 180,000 Material: $2.98 per EU 09/30/2023 Total cost transferred out to next dept.: $948.526 The "What If" part of the assignment will help you determine whether you have correctly used cell referencing in your spreadsheets. In your data block page make the following changes: 1. Beginning inventory for WIP, September 1 is 40,000 units; 75% complete as to material costs and 75% complete as to conversion costs. (This is August 31, 2023 ending inventory from the previous report which becomes September 1, 2023 beginning inventory in this report.) 2. Ending WIP inventory, September 30,2023 is 20,000 units; 80% complete as to material costs and 75% complete as to conversion costs. 3. Units started into production for September are 200,000 . 4. Carryover the material and conversion costs assigned to the ending WIP August 31, 2023 (from the August report) as the beginning WIP inventory prior period costs. (Material Costs $90,000 and Conversion Costs: $38,097.) 5. Costs added during September are: $613,880 for materials and $274,300 for conversion. 6. Change the date in the heading to be "For the Month Ended September 30, 2023". If you prepared part 1 (August 31, 2023 Production Report) correctly your spreadsheets should automatically recalculate using the new data. You should not have to change any of the cell references or formulas for the September 30, 2023 Production Report - If you do then you have done the cell referencing incorrectly. You are only changing the Data Block page. ORIGINAL PROBLEM DATA ( 1ST Excel File): CHECK FIGURES: Units started and Completed 160,000 Conversion: $1.27 per EU 8/31/2023 EB WIP $128,097 is Supreme Manufacturing was founded over 35 years ago in East Brunswick, NJ. Supreme's Muy Refresc de Tropical line of Horchata, Tamarindo, and Jamaica drinks are lovingly re-created from Latino recipes handed down through the generations. The Muy Refresc de Tropical line uses only natural cinnamon, vanilla, rice, tamarind root, and hibiscus flower, and is sweetened only with all-natural cane sugar. A long-time cultural favorite, the popularity of Horchata, Tamarindo, and Jamaicas, has exploded in recent years. This is due to both the general market's exposure to aquas frescas, and the rapid growth of the Latino market's population and buying power. The U.S. Latino population is currently growing faster than the general market with growth of 43% over the last 10 years - or 16.3% of the entire U.S. population. Along with this growth, a new awareness of the potenral health dangers of processed, sugary foods has emerged across all markets. Muyl 3 efresco' de Jrepical's, natural ingredients and real cane sugar mean they're free of fat, cholesterol, caffeine, lactose, and gluten. Supreme's Horchata, Tamarindo, and Jamaica: a naturally delicious, healthier alternative to today's sugary sodas. Each flavor is available in 64fl. oz. bottles and sold for $12 each. The first stage in the production process is carried out in the Mixing Department, which removes foreign matter from the raw materials and mixes them in the proper proportions in large vats. The company uses the FIFO method in its process costing system. Production data for the month of August appears below: Production data: Units in process, August 1 (materials 90% complete; conversion 80% complete) 30,000 Units started into production. 200,000 Units in process, August 31 (materials 75% complete; conversion 75% complete) 40,000 Cost data: Work in process inventory, August 1: Materials cost $67,800 Conversion cost $30,200 Cost added during the month: Materlals cost $579,000 Conversion cost $248,900 Work in prosess, beginning Cost added by the department Total cost Equivalent units of production Cost per equivalent unit Cost of Ending WIP and Units Transforred Out Cost of Ending WP and Units Transferred Out Work in process, ending Materials Corversion Cost per Equivalent Unit Total work in process Transterred to packaging From the beginning inventory. Cost in the beginning imventory Cost to complete beginning inventory Materials Conversion Cost per Equivalent Unit Total cost to complele beginning inventory Slarted and completed this month Cost per Equivalent Unit Total costs of units started and compleled this month Tolal cost transterred Total Cost Materials Conversion Whole Unit \$ 15,175 . \begin{tabular}{|r|r|r|} 719,500 & S 368,600 & S 350,900 \\ \hline 5734,675 & \end{tabular} 4,850$7600+$72840 Equvalent Units (above) \begin{tabular}{|c|c|c|} \hline Materials & Corversion & Total Cost \\ \hline & & \\ \hline & & \\ \hline \multicolumn{3}{|l|}{160} \\ \hline & 100 & \\ \hline$7600 & $7250 & \\ \hline \multirow[t]{3}{*}{$12,160} & $7,250 & S 19410 \\ \hline & & \\ \hline & 0 & \\ \hline$9,600 & $5,575 & S 15,175 \\ \hline \multicolumn{3}{|l|}{90} \\ \hline & 140 & \\ \hline$7600 & $7250 & \\ \hline$6,840 & $10,150 & $16,990 \\ \hline 4,600 & 4,600 & \\ \hline$7600 & $7250 & \\ \hline \multirow[t]{2}{*}{$349,600} & $333,500 & $683,100 \\ \hline & & 5715,265 \\ \hline \end{tabular} Cost Reconcillation Schedule Costs to be accounted for Cost of beginning work in process Costs added to production duning the period Total cost to be accounted for Costs accounted for Cost of ending work in process inventory Cost of units transferred out S 15,175 \begin{tabular}{rr} 719,500 \\ \hline 5.734,875 \\ \hline \end{tabular} Total cost accounted for S 19,410 715.2655734675


