Answered step by step
Verified Expert Solution
Link Copied!

Question

1 Approved Answer

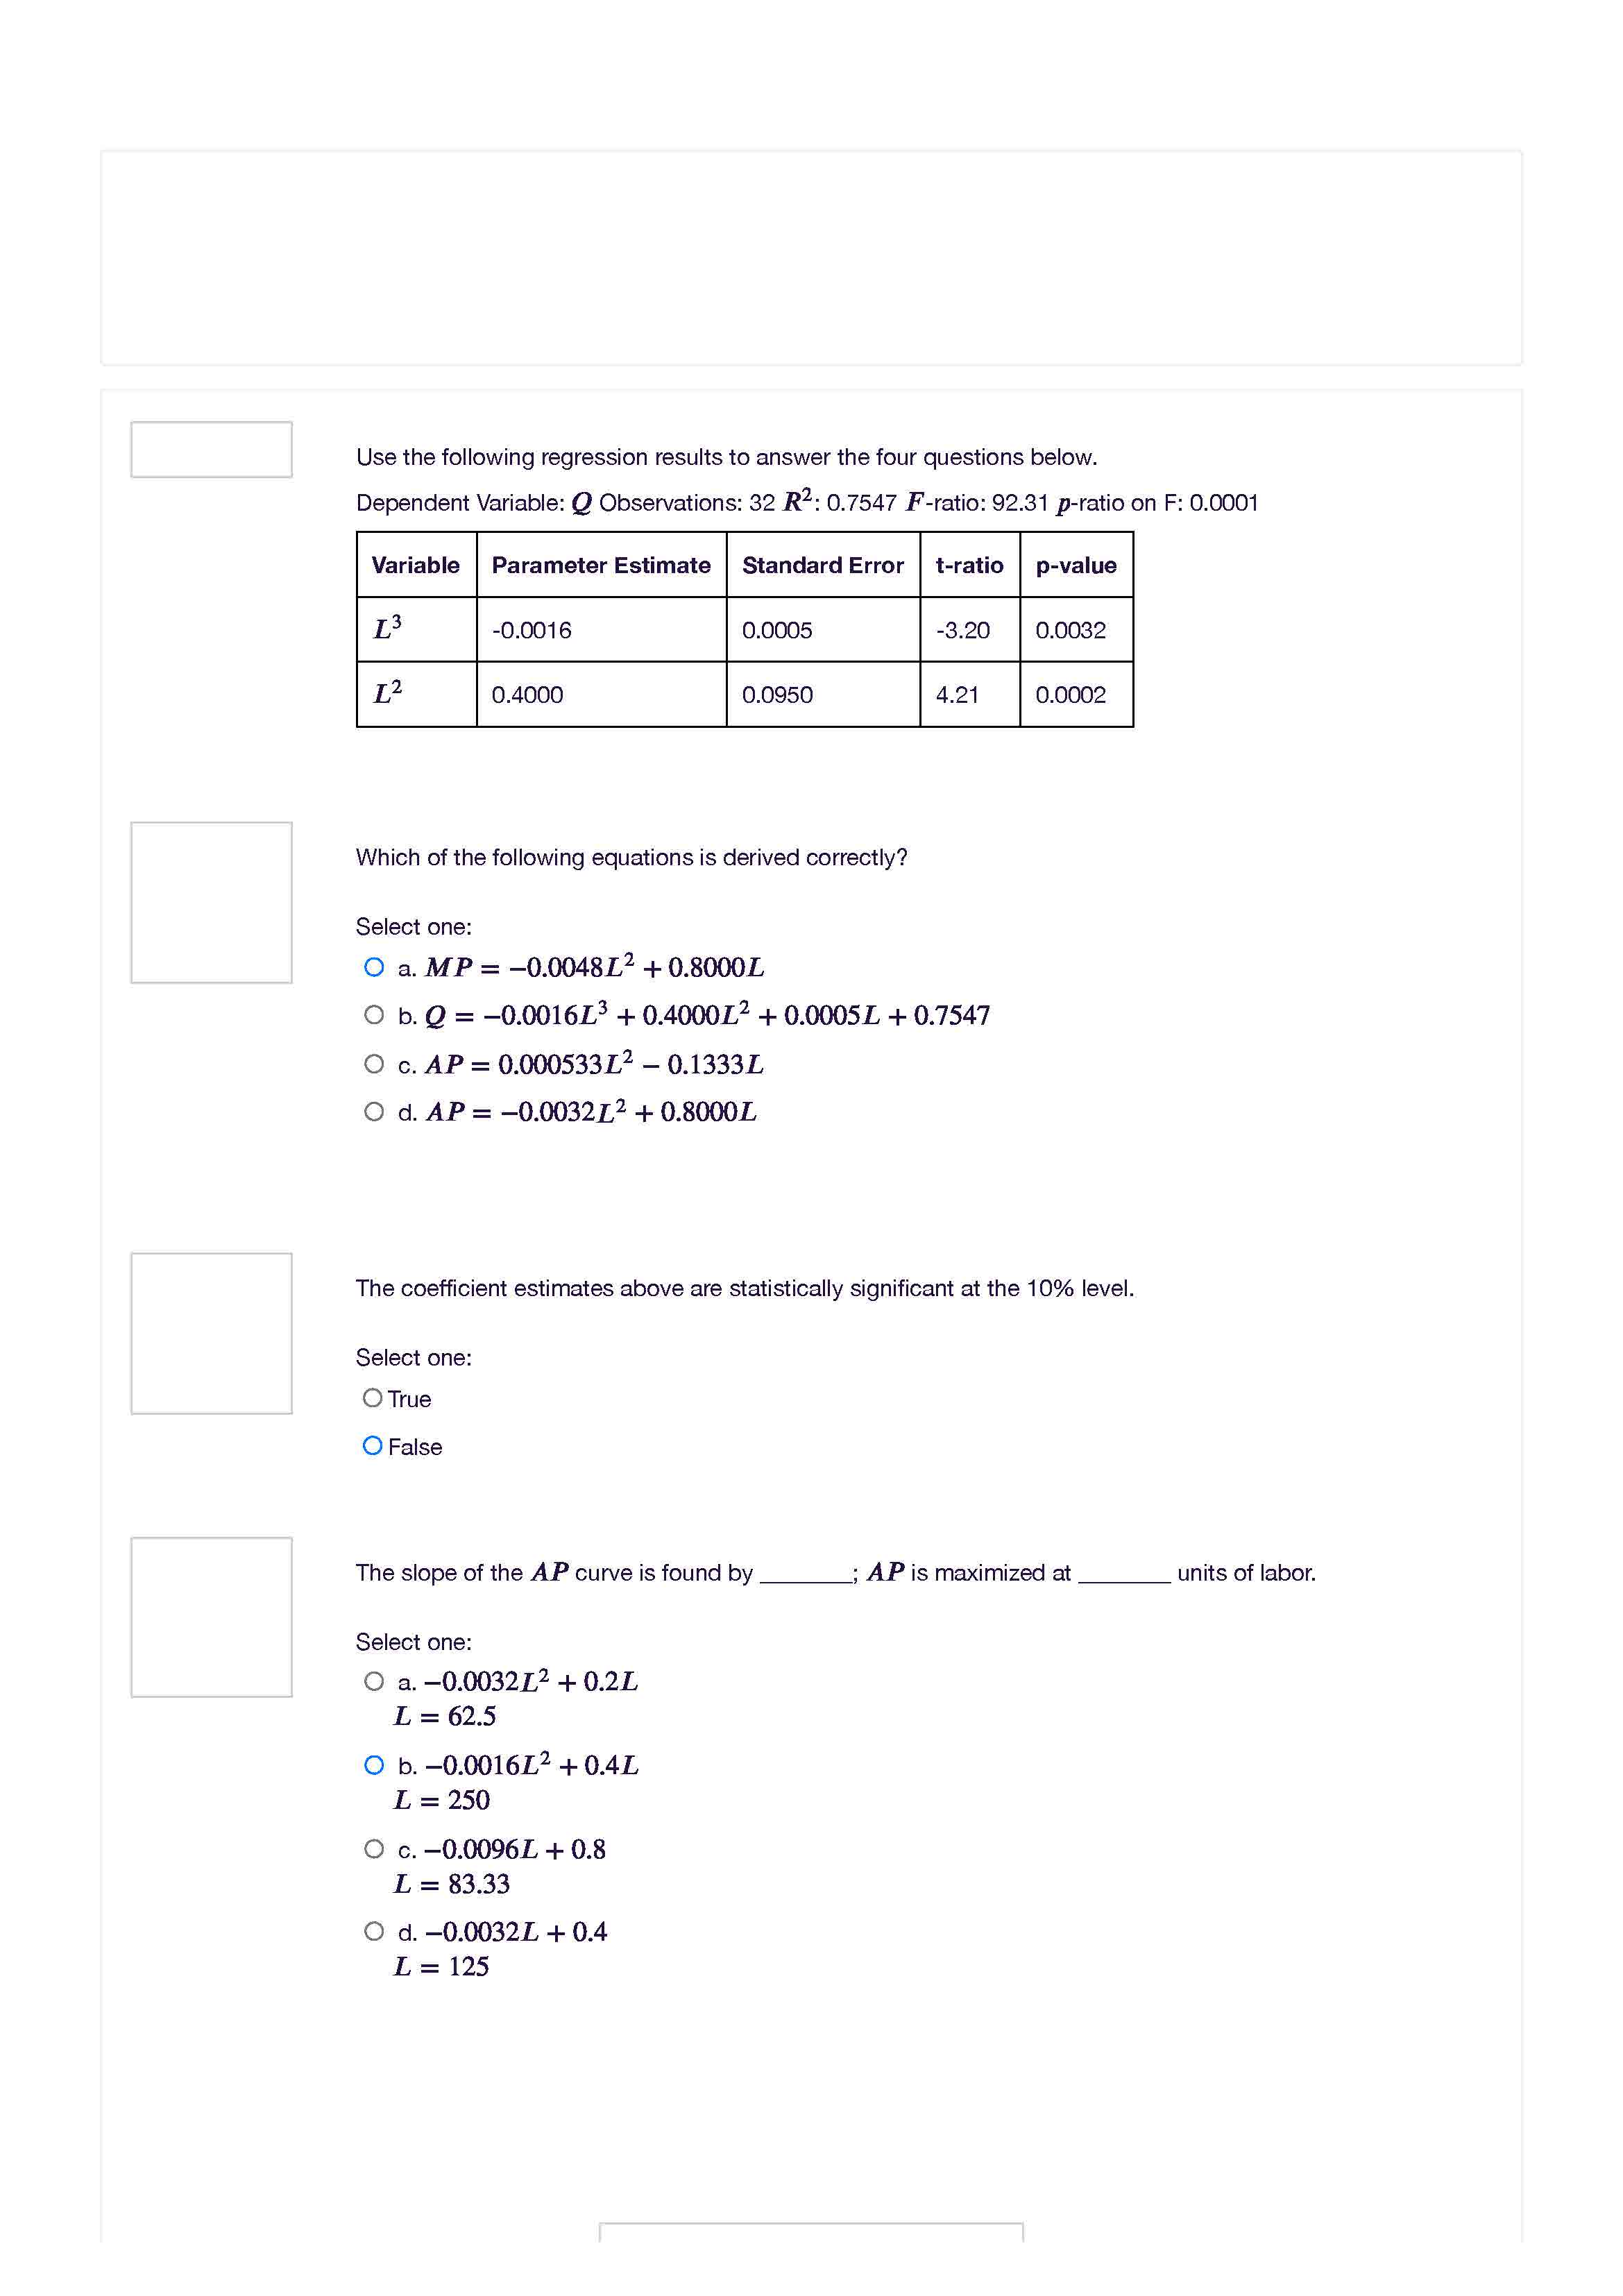
Please explain so I can understand the reason behind it. Use the following regression results to answer the four questions below. Dependent Variable: Q Observations:

Please explain so I can understand the reason behind it.

image text in transcribed
Use the following regression results to answer the four questions below. Dependent Variable: Q Observations: 32 R2: 0.7547 Fratio: 92.31 p-ratio on F: 0.0001 Parameter Estimate Standard Error m p-value -0.0016 0.0005 0.0032 0.4000 0.0950 4.21 0.0002 Which of the following equations is derived correctly? Select one: Q a. MP = 0.()048L2 + 0.8000L o b. Q = o.0016L3 + 0.4000L2 + 0.0005L + 0.7547 0 0. AP = 0.000533L2 0.1333L o d. AP = ().0032L2 + 0.8000L The coefficient estimates above are statistically significant at the 10% level. Select one: 0 True 0 False The slope of the AP curve is found by ; AP is maximized at units of labor. Select one: 0 a. 0.0032L2 + 0.2L L = 62.5 o b. 0.0()16L2 + 0.4L L = 250 O c. 0.0096L + 0.8 L = 83.33 C d. 0.0032L + 0.4 L = 125

Step by Step Solution

There are 3 Steps involved in it

Step: 1

blur-text-image

Get Instant Access to Expert-Tailored Solutions

See step-by-step solutions with expert insights and AI powered tools for academic success

Step: 2

blur-text-image

Step: 3

blur-text-image

Ace Your Homework with AI

Get the answers you need in no time with our AI-driven, step-by-step assistance

Get Started

Recommended Textbook for

International Economics Theory and Policy

Authors: Paul R. Krugman, Maurice Obstfeld, Marc J. Melitz

9th Edition

978-0132146654, 0132146657, 9780273754091, 978-0273754206

More Books