

Question
Please explain step by step how to solve the problems, the formulas needed, and what page on the z chart is used. please use these


Please explain step by step how to solve the problems, the formulas needed, and what page on the z chart is used.
please use these formulas and the z chart at the bottom otherwise it may turn out wrong
Thank you
A1)
Shopping for the sedan and would like to get excellentmiles per gallon(MPG). I heard that Korean cars tend to be more fuel-efficient than American cars. I got a random sample of 15 Korean 4-cylinder sedan models (listed in the table below) to be compared to the American car statistics. I would like to see if there is a significant difference, in either direction. The average MPG for American sedans in 2017 is=31.8. I set the significance level at? = .10 for a two-tailed hypothesis test.
| Korean Car Model | MPG |
| 1 | 28 |
| 2 | 33 |
| 3 | 36 |
| 4 | 30 |
| 5 | 25 |
| 6 | 27 |
| 7 | 36 |
| 8 | 30 |
| 9 | 26 |
| 10 | 36 |
| 11 | 28 |
| 12 | 32 |
| 13 | 27 |
| 14 | 35 |
| 15 | 31 |
A1 A. Information about the hypothesis test:
1. What is the dependent variable in this hypothesis test?
2. What is the "sample" for this one-samplettest?
3. What is the target population representedby the sample?
4. What is the comparison population?
A1 B. What would be the null and alternative hypotheses in both words and symbol notations for my analysis?
| Written | Symbolic Symbol bank for copy & pasting: =m | |
| Null | H0:
| |
| Alternative | H1:
|
A1 C. Calculate the sample mean.Round the result to the hundredth (2ndplace to the right of the decimal).
A1 D. Estimate the standard deviation of the population from which the sample was drawn. Round the result to the hundredth
A1 E. Calculate the standard error
A1 F. Calculate thetstatistic for the sample
A1 G.
1. Figure out the degree of freedom
2.Determine the criticaltvalue(s)
A1 H.
1. Is the calculatedtstatistic more extreme or less extreme than the criticaltvalue?
2.Based on this comparison, do we "reject" or "fail to reject" the null hypothesis?
A1 I. Interpret the result in 1 sentence to answer the research question
A1 J. Calculate the standardized effect size of this hypothesis test.Round the result to HUNDRETH
A2)
Tracking the cognitive functions . Tested at 70 years old and again at 80 years old. The researcher wants to know if there is a significant decline in memory from age 70 to age 80 . It is hypothesized that the memory score at age 80 is lower than the memory score at 70. So the null and alternative hypotheses should be directional. The alpha level was set at? = .05 for a one-tailed hypothesis test.
| Memory score | ||
| Subject | Age 70 | Age 80 |
| 1 | 55 | 52 |
| 2 | 63 | 62 |
| 3 | 53 | 57 |
| 4 | 59 | 49 |
| 5 | 54 | 50 |
| 6 | 55 | 56 |
| 7 | 55 | 48 |
| 8 | 59 | 56 |
| 9 | 59 | 54 |
| 10 | 58 | 46 |
A2A.
Dependent Variable: | |
Independent Variable: |
A2B. Explain why a paired-samplesttest is appropriate for answering this research question.
A2C. What would be the null and alternative hypotheses in both words and symbol notations?
| Written | Symbolic Symbol bank for copy & pasting: =m | |
| Null | H0: | |
| Alternative | H1: |
A2D. Calculate the difference score bysubtracting each "Age 70" score from the associated "Age 80"score for each subject.
| Subject | Difference score (Age 80 - Age 70) |
| 1 | |
| 2 | |
| 3 | |
| 4 | |
| 5 | |
| 6 | |
| 7 | |
| 8 | |
| 9 | |
| 10 |
A2E. Calculate the mean from the sample of difference scores.Round the result to the hundredth (2ndplace to the right of the decimal).
A2F. Estimate the standard deviation of the population of difference scores.Round the result to the hundredth (2ndplace to the right of the decimal).
A2G. Calculate the standard error (standard deviation of the sampling distribution).Round the result to the hundredth (2ndplace to the right of the decimal).
A2H. Calculate thetstatistic for the sample of difference scores. Round the result to the thousandth (3rdplace to the right of the decimal).
A2I.
1. Figure out the degree of freedom
2.Determine the criticaltvalue(s)
A2J.
1. Is the calculatedtstatistic more extreme or less extreme than the criticaltvalue?
2.Based on this comparison, do we "reject" or "fail to reject" the null hypothesis?
A2K. Interpret the result in 1 sentence to answer the research question
A2L. Calculate the standardized effect size of this hypothesis test.Round to the hundredth (
A3.
The encoding condition could effect memory for a list of words. She recruits 15 subjects to participate. Each subject comes to the lab twice to be tested in two different encoding conditions. The researcher left the hypothesis non-directional without predicting and sets the significance level at? = .05 for a two-tailed test.
| Subject ID | Encoding A | Encoding B |
| 1 | 177 | 176 |
| 2 | 189 | 193 |
| 3 | 185 | 188 |
| 4 | 178 | 175 |
| 5 | 181 | 176 |
| 6 | 186 | 184 |
| 7 | 193 | 191 |
| 8 | 190 | 187 |
| 9 | 187 | 179 |
| 10 | 182 | 178 |
| 11 | 179 | 176 |
| 12 | 188 | 181 |
| 13 | 186 | 190 |
| 14 | 188 | 187 |
| 15 | 194 | 193 |
A3 A. Identify the dependent variable (this is the outcome measure) and the independent variable (this is what differentiates the two groups of data points being compared).
Dependent Variable: | |
Independent Variable: |
A3B. What would be the null and alternative hypotheses in both words and symbol notations?
| Written | Symbolic Symbol bank for copy & pasting: =m | |
| Null | H0: | |
| Alternative | H1: |
A3C (Round results to the hundredth
1.. Calculate the mean of the difference scores.
Subject ID | Difference |
1 | |
2 | |
3 | |
4 | |
5 | |
6 | |
7 | |
8 | |
9 | |
10 | |
11 | |
12 | |
13 | |
14 | |
15 |
2. Estimated population standard deviation.
3. Standard error.
4. Calculatedtstatistic.
A3D. With the calculated t statistic, perform the following steps to conclude the hypothesis test.
1. Criticaltvalue
2. Make a decision about the hypothesis test, stating explicitly "reject" or "fail to reject" accordingly.
3. Calculate the standardized effect size of this hypothesis test.
USE THESE FORMULAS
Mean: M = ?X/N * Mean = Sum of all scores / number of scores ______________________________________________________________________________ Median: is the middle score of all the scores in a sample when the scores are arranged in ascending order. If there is no single middle score, the median is the mean of the two middle scores. _____________________________________________________________________________ Mode: The score (data point value) that occurs the most in the data set. ______________________________________________________________________________ Variance: Variance = [?(X-M)2]/N Standard Deviation: SD = ?[?(X-M)2]/N *Calculate the difference between X and M. Square each difference score. Add all the squared difference scores and divide by N. This gives us the variance, which is the Standard deviation squared. So, the square root of the variance is the standard deviation. *This is the formula for variance and Standard deviation of the SAMPLE! ______________________________________________________________________________ Probability: Probability = target/total ______________________________________________________________________________ Z Score/Raw Score: Z = (X-?)/? *Population Mean = ? *Population Standard Deviation = ?
?Raw Score = X *Z score = Z ______________________________________________________________________________ Standard Error: SE = ?/?N *Population Standard Deviation = ? ?Number of Scores = N ______________________________________________________________________________ Z Statistic: Z = (M-?)/SE *Sample Mean = M *Population Mean = ? *Standard Error = SE *The z statistic is used in a z test (which is different than when we found the z score in M2). The Z test is used when we have only one sample and we know the mean and the standard deviation of the population from the published norms. Additionally, it is a statistical technique to test the Null Hypothesis against the Alternate Hypothesis. ______________________________________________________________________________ Standardized Effect Size: d = (M-?)/? *Effect Size = d *Sample Mean = M *Population Mean = ? *Population Standard Deviation = ? ______________________________________________________________________________ Variance of Population: s2 = [?(X-M)2]/N-1 Standard Deviation of the Population: s = ?[?(X-M)2]/N-1 *Labeled as the "Estimated Population Standard Deviation"
*Calculate the difference between X and M. Square each difference score. Add all the squared difference scores and divide by N-1. This gives us the variance, which is Standard deviation squared. So, the square root of the variance is the standard deviation. *This is the formula for variance and Standard deviation of the POPULATION! ->Slightly different formula than SD in Module 1 ______________________________________________________________________________ Standard Error for a t-test: SE = s/?N *Also known as the standard deviation of the sampling distribution = SE *Estimated Population Standard Deviation = s *Number of Scores = N ______________________________________________________________________________ t statistic: t = (M-?)/SE *t statistic = t *Sample Mean = M *Population Mean = ? *Standard Error (or SD of Sampling Distribution) = SE ______________________________________________________________________________ Degrees of Freedom: df = N-1 ______________________________________________________________________________ Standardized Effect Size for t-test: d = (M-?)/s *Sample Mean = M *Population Mean = ? *Effect size = d *Estimated Population Standard Deviation = s ______________________________________________________________________________ Total Degrees of Freedom: Dftotal = df1 + df2
*df = N-1 ______________________________________________________________________________ Pooled Variance: Spooled2 = (df1 / dftotal)(S12) + (df2 / dftotal)(S22) *Estimated Population Variance = S2 Pooled Standard Deviation: Spooled2 = ? Spooled ______________________________________________________________________________ Variance for Sampling Distribution: SM12 = Spooled2/N1 SM22 = Spooled2/N2
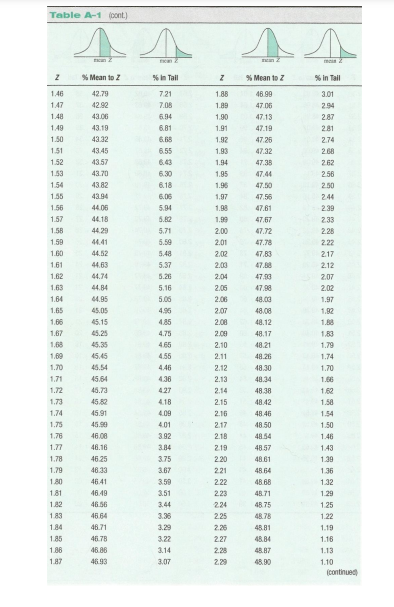
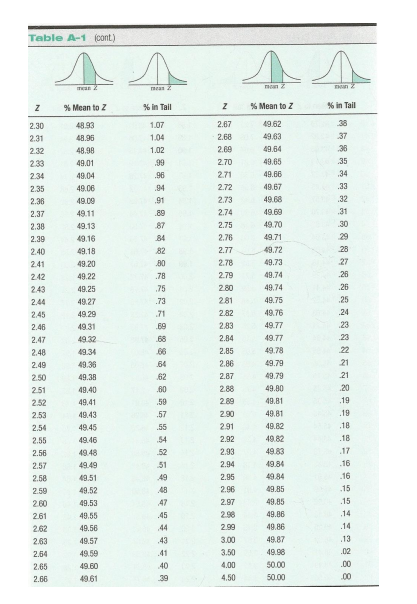
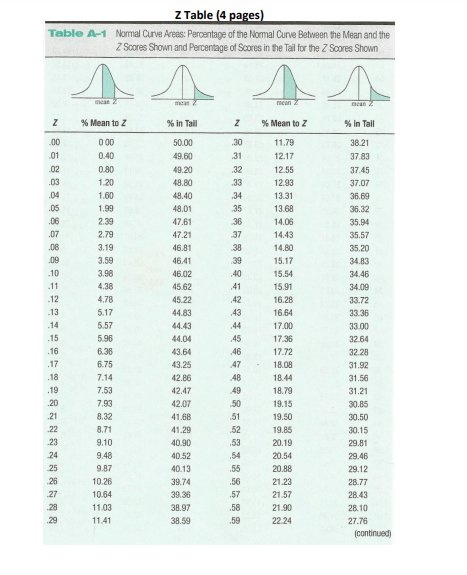
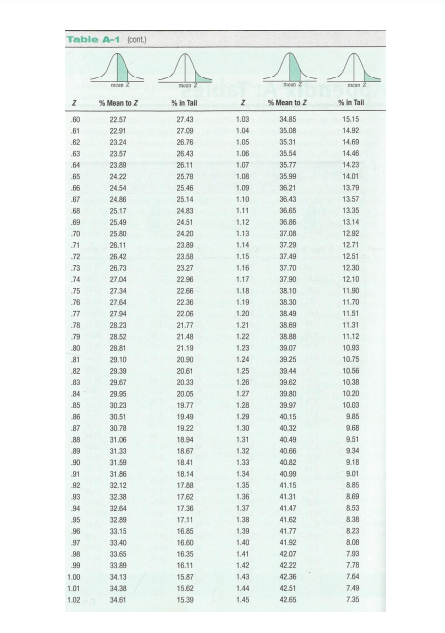
Z CHART


Step by Step Solution
There are 3 Steps involved in it
Step: 1

Get Instant Access to Expert-Tailored Solutions
See step-by-step solutions with expert insights and AI powered tools for academic success
Step: 2

Step: 3
Ace Your Homework with AI
Get the answers you need in no time with our AI-driven, step-by-step assistance
Get Started
A Handbook Of Statistical Analyses Using Sas
Authors: Geoff Der, Brian S Everitt
3rd Edition
1584887850, 9781584887850