Answered step by step
Verified Expert Solution
Link Copied!

Question

1 Approved Answer

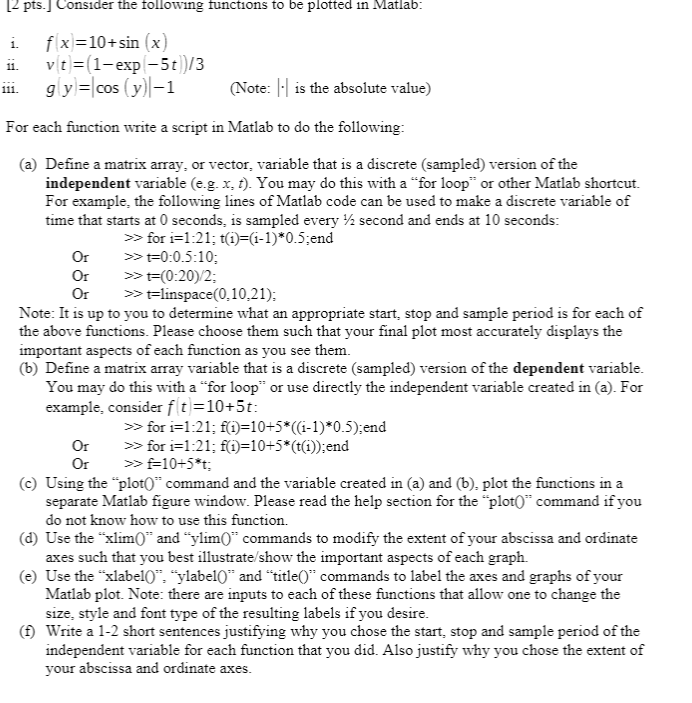
Please explain steps. once the first one is done i can try to do the other 2 equations. Thank you [2 pts. ] Consider the

Please explain steps. once the first one is done i can try to do the other 2 equations. Thank you

image text in transcribed

[2 pts. ] Consider the following functions to be plotted in Matlab: i. f x =10+ sin(x) 11. vt =(1-exp -50/3 111. g y = cos(y)-1 (Note: - is the absolute value) For each function write a script in Matlab to do the following: (a) Define a matrix array, or vector, variable that is a discrete (sampled) version of the independent variable (eg. x, t). You may do this with a "for loop" or other Matlab shortcut. For example, the following lines of Matlab code can be used to make a discrete variable of time that starts at 0 seconds, is sampled every 12 second and ends at 10 seconds: >> for i=1:21; t(1)=(1-1)*0.5;end Or >> t=0:0.5:10: Or >> =(0-20)/2: Or >>t=linspace(0.10,21); Note: It is up to you to determine what an appropriate start, stop and sample period is for each of the above functions. Please choose them such that your final plot most accurately displays the important aspects of each function as you see them. (6) Define a matrix array variable that is a discrete (sampled) version of the dependent variable. You may do this with a "for loop or use directly the independent variable created in (a). For example, consider f t = 10+5t: >> for i=1:21: f(i=10+5*((1-1)*0.5); end Or >> for i=1:21: f(1)=10+5*(t(1));end >> F=10+5*t; C) Using the "plot(" command and the variable created in (a) and (b), plot the functions in a separate Matlab figure window. Please read the help section for the plot0 command if you do not know how to use this function. (d) Use the xlim and "ylim()* commands to modify the extent of your abscissa and ordinate axes such that you best illustrate show the important aspects of each graph. (e) Use the "xlabel()", "ylabel0" and "title()" commands to label the axes and graphs of your Matlab plot. Note: there are inputs to each of these functions that allow one to change the size, style and font type of the resulting labels if you desire. (1) Write a 1-2 short sentences justifying why you chose the start, stop and sample period of the independent variable for each function that you did. Also justify why you chose the extent of your abscissa and ordinate axes

Step by Step Solution

There are 3 Steps involved in it

Step: 1

blur-text-image

Get Instant Access to Expert-Tailored Solutions

See step-by-step solutions with expert insights and AI powered tools for academic success

Step: 2

blur-text-image

Step: 3

blur-text-image

Ace Your Homework with AI

Get the answers you need in no time with our AI-driven, step-by-step assistance

Get Started

Recommended Textbook for

101 Database Exercises Text Workbook

Authors: McGraw-Hill

2nd Edition

0028007484, 978-0028007489

Students also viewed these Databases questions

Question

=+5 Evaluate whether the CCT program was effective.

Answered: 1 week ago

Question

=+Identify the type of global assignment for which CCT is needed.

Answered: 1 week ago