Answered step by step
Verified Expert Solution
Link Copied!

Question

1 Approved Answer

Please explain the step by step explanation. Researchers wanted to know whether there was a difference in comprehension among students learning a computer program based

Please explain the step by step explanation.
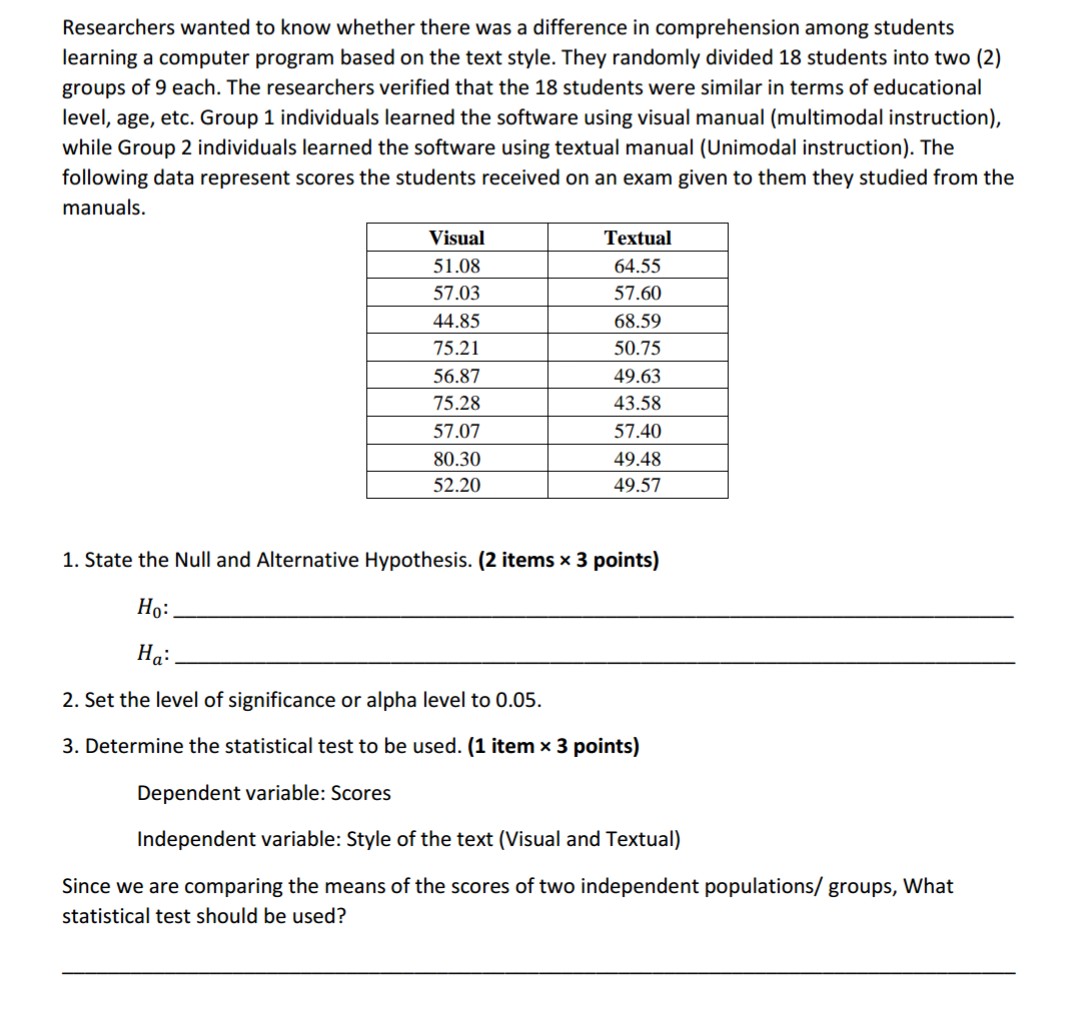
image text in transcribedimage text in transcribedimage text in transcribed
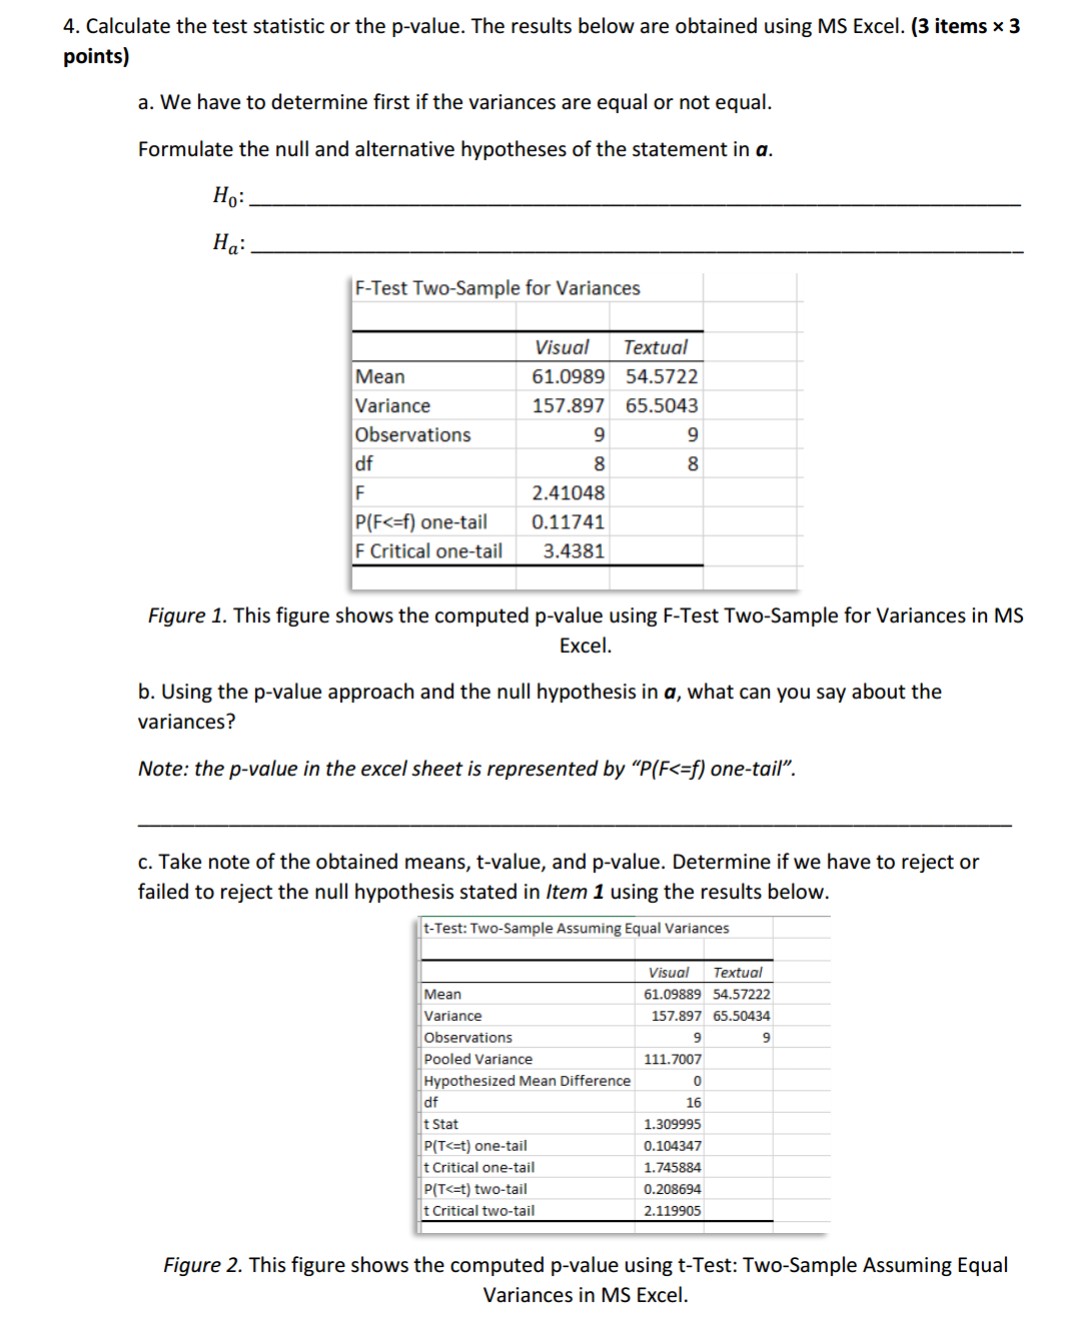
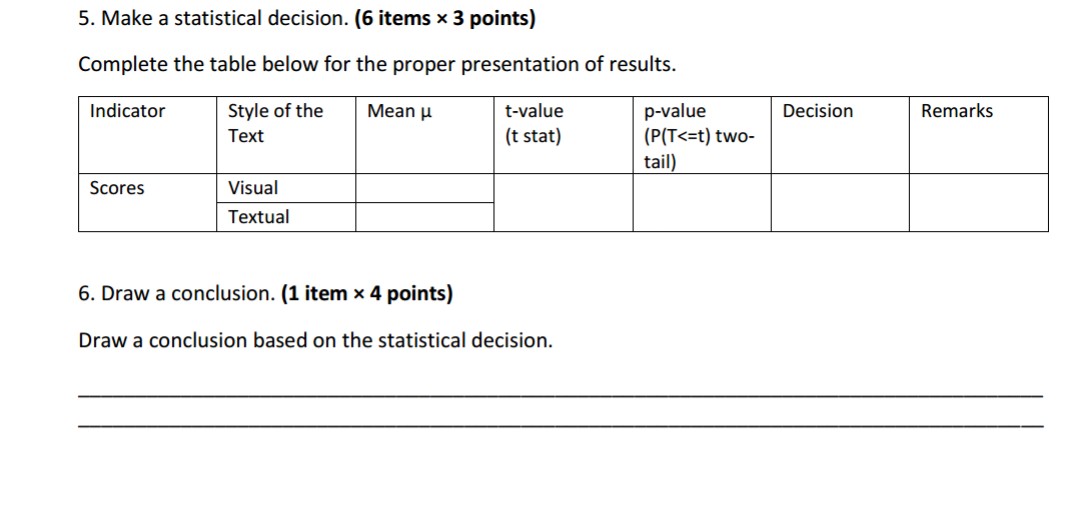
Researchers wanted to know whether there was a difference in comprehension among students learning a computer program based on the text style. They randomly divided 18 students into two (2) groups of 9 each. The researchers verified that the 18 students were similar in terms of educational level, age, etc. Group 1 individuals learned the software using visual manual (multimodal instruction), while Group 2 individuals learned the software using textual manual (Unimodal instruction). The following data represent scores the students received on an exam given to them they studied from the manuals. Visual Textual 51.08 64.55 57.03 57.60 44.85 68.59 75.21 50.75 56.87 49.63 75.28 43.58 57.07 57.40 80.30 49.48 52.20 49.57 1. State the Null and Alternative Hypothesis. (2 items x 3 points) Ho: Ha: 2. Set the level of significance or alpha level to 0.05. 3. Determine the statistical test to be used. (1 item x 3 points) Dependent variable: Scores Independent variable: Style of the text (Visual and Textual) Since we are comparing the means of the scores of two independent populations/ groups, What statistical test should be used?4. Calculate the test statistic or the p-value. The results below are obtained using MS Excel. (3 items x 3 points) a. We have to determine first if the variances are equal or not equal. Formulate the null and alternative hypotheses of the statement in a. Ho: Ha: F-Test Two-Sample for Variances Visual Textual Mean 61.0989 54.5722 Variance 157.897 65.5043 Observations 9 9 df 8 8 F 2.41048 P(F

Step by Step Solution

There are 3 Steps involved in it

Step: 1

blur-text-image

Get Instant Access to Expert-Tailored Solutions

See step-by-step solutions with expert insights and AI powered tools for academic success

Step: 2

blur-text-image

Step: 3

blur-text-image

Ace Your Homework with AI

Get the answers you need in no time with our AI-driven, step-by-step assistance

Get Started

Recommended Textbook for

An Introduction to Measure Theoretic Probability

Authors: George G. Roussas

2nd edition

128000422, 978-0128000427

More Books

Students also viewed these Mathematics questions