Please fill in T1 and indicate the bad trend including years and problem indicated by bad trend. (Leave blank if you are not concerned).
| | t-1 | t-2 | t-3 | Bad trend including years | Problem indicated by bad trend |
| DIH | | 109.511 | 99.516 | | |
| DSO | | 59.921 | 56.065 | | |
| TATO | | 0.785 | 0.876 | | |
| DEBT | | 0.413 | 0.432 | | |
| NPM | | 0.102 | 0.104 | | |
| OCF | | 1,193,595 | 1,345,289 | | |
| FCF | | (6,995) | (641,636) | | |
| OCF+ICF | | (47,106) | 673,164 | | |
Please use the below for reference. 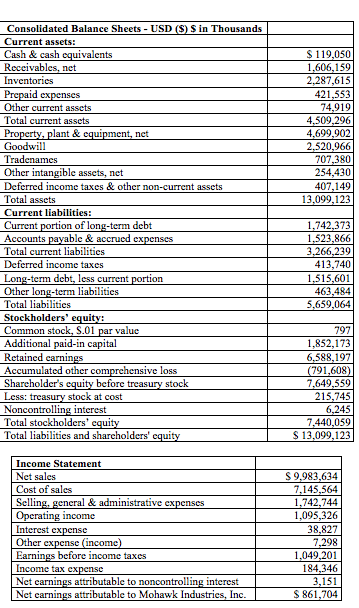
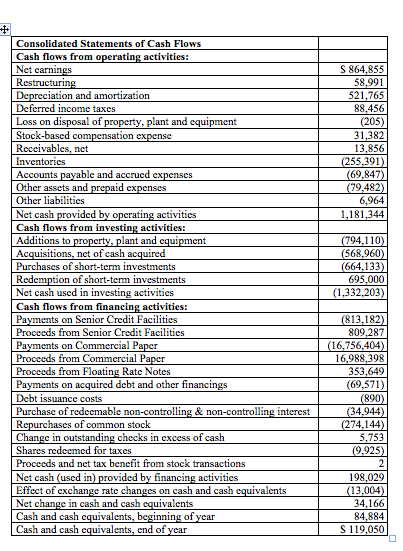
$ 119,050 1,606,159 2,287,615 421,553 74,919 4,509,296 4,699,902 2,520,966 707,380 254,430 407,149 13,099,123 Consolidated Balance Sheets - USD ($) Sin Thousands Current assets: Cash & cash equivalents Roccivables, net Inventories Prepaid expenses Other current assets Total current assets Property, plant & equipment, net Goodwill Tradenames Other intangible assets, net Deferred income taxes & other non-current assets Total assets Current liabilities: Current portion of long-term debt Accounts payable & accrued expenses Total current liabilities Deferred income taxes Long-term debt, less current portion Other long-term liabilities Total liabilities Stockholders' cquity: Common stock, S.01 par value Additional paid-in capital Retained earnings Accumulated other comprehensive loss Shareholder's equity before treasury stock Less: treasury stock at cost Noncontrolling interest Total stockholders' equity Total liabilities and shareholders' cquity 1,742,373 1,523,866 3,266,239 413,7401 1.515,601 463,484 5,659,064 797 1,852,173 6,588,197 (791,608) 7,649,559 215,745 6,245 7,440,059 $ 13,099,123 Income Statement Net sales Cost of sales Selling, general & administrative expenses Operating income Interest expense Other expense (income) Earnings before income taxes Income tax expense Net carnings attributable to noncontrolling interest Net carnings attributable to Mohawk Industries, Inc. S 9.983,634 7,145,564 1,742,744 1,095,326 38,827 7,298 1,049,201 184,346 3,151 $ 861,704 S 864,855 58,991 521,765 88,456 (205) 31,382 13,856 (255,391) (69,847) (79,482) 6,964 1,181,344 Consolidated Statements of Cash Flows Cash flows from operating activities: Net carnings Restructuring Depreciation and amortization Deferred income taxes Loss on disposal of property, plant and equipment Stock-based compensation expense Receivables, net Inventories Accounts payable and accrued expenses Other assets and prepaid expenses Other liabilities Net cash provided by operating activities Cash flows from investing activities: Additions to property, plant and equipment Acquisitions, net of cash acquired Purchases of short-term investments Redemption of short-term investments Net cash used in investing activities Cash flows from financing activities: Payments on Senior Credit Facilities Proceeds from Senior Credit Facilities Payments on Commercial Paper Proceeds from Commercial Paper Proceeds from Floating Rate Notes Payments on acquired debt and other financings Debt issuance costs Purchase of redeemable non-controlling & non-controlling interest Repurchases of common stock Change in outstanding checks in excess of cash Shares redeemed for taxes Proceeds and net tax benefit from stock transactions Net cash (used in) provided by financing activities Effect of exchange rate changes on cash and cash equivalents Net change in cash and cash equivalents Cash and cash equivalents, beginning of year Cash and cash equivalents, end of year (794,110) (568,960) (664,133) 695,000 (1,332,203) (813,182) 809,287 (16,756,404) 16,988,398 353,649 (69,571) (890) (34,944) (274,144) 5,753 (9,925) 2 198,029 (13,004) 34,166 84,884 S 119,050 $ 119,050 1,606,159 2,287,615 421,553 74,919 4,509,296 4,699,902 2,520,966 707,380 254,430 407,149 13,099,123 Consolidated Balance Sheets - USD ($) Sin Thousands Current assets: Cash & cash equivalents Roccivables, net Inventories Prepaid expenses Other current assets Total current assets Property, plant & equipment, net Goodwill Tradenames Other intangible assets, net Deferred income taxes & other non-current assets Total assets Current liabilities: Current portion of long-term debt Accounts payable & accrued expenses Total current liabilities Deferred income taxes Long-term debt, less current portion Other long-term liabilities Total liabilities Stockholders' cquity: Common stock, S.01 par value Additional paid-in capital Retained earnings Accumulated other comprehensive loss Shareholder's equity before treasury stock Less: treasury stock at cost Noncontrolling interest Total stockholders' equity Total liabilities and shareholders' cquity 1,742,373 1,523,866 3,266,239 413,7401 1.515,601 463,484 5,659,064 797 1,852,173 6,588,197 (791,608) 7,649,559 215,745 6,245 7,440,059 $ 13,099,123 Income Statement Net sales Cost of sales Selling, general & administrative expenses Operating income Interest expense Other expense (income) Earnings before income taxes Income tax expense Net carnings attributable to noncontrolling interest Net carnings attributable to Mohawk Industries, Inc. S 9.983,634 7,145,564 1,742,744 1,095,326 38,827 7,298 1,049,201 184,346 3,151 $ 861,704 S 864,855 58,991 521,765 88,456 (205) 31,382 13,856 (255,391) (69,847) (79,482) 6,964 1,181,344 Consolidated Statements of Cash Flows Cash flows from operating activities: Net carnings Restructuring Depreciation and amortization Deferred income taxes Loss on disposal of property, plant and equipment Stock-based compensation expense Receivables, net Inventories Accounts payable and accrued expenses Other assets and prepaid expenses Other liabilities Net cash provided by operating activities Cash flows from investing activities: Additions to property, plant and equipment Acquisitions, net of cash acquired Purchases of short-term investments Redemption of short-term investments Net cash used in investing activities Cash flows from financing activities: Payments on Senior Credit Facilities Proceeds from Senior Credit Facilities Payments on Commercial Paper Proceeds from Commercial Paper Proceeds from Floating Rate Notes Payments on acquired debt and other financings Debt issuance costs Purchase of redeemable non-controlling & non-controlling interest Repurchases of common stock Change in outstanding checks in excess of cash Shares redeemed for taxes Proceeds and net tax benefit from stock transactions Net cash (used in) provided by financing activities Effect of exchange rate changes on cash and cash equivalents Net change in cash and cash equivalents Cash and cash equivalents, beginning of year Cash and cash equivalents, end of year (794,110) (568,960) (664,133) 695,000 (1,332,203) (813,182) 809,287 (16,756,404) 16,988,398 353,649 (69,571) (890) (34,944) (274,144) 5,753 (9,925) 2 198,029 (13,004) 34,166 84,884 S 119,050