Please Fill in the boxes
the references are provided below
Market Share % = Company Units Sold/Total Units Sold in the market X 100
| Y10 | Y11 | Y12 | |
| Market Share (based on pairs) % | | | | |
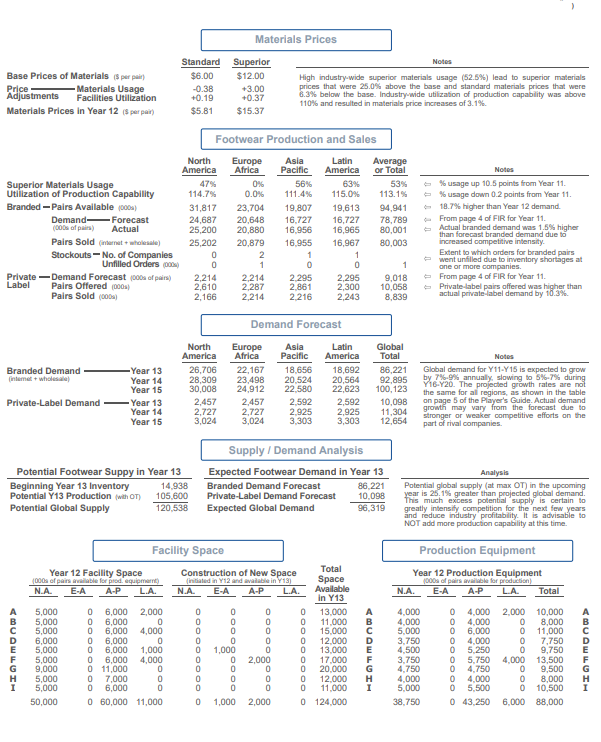
Materials Prices Standard Superior Notes Base Prices of Materials ($ par pair) $6.00 $12.00 High industry wide superior materials usage (52.8%) lead to superior materials Materials Usage -0.38 +3.00 prices that were 25.0% above the base and standard materials prices that were Adjustments Facilities Utilization +0.19 +0.37 6.3% below the base. Industry-wide utilization of production capability was above 110% and resulted in materials price increases of 3.1%. Materials Prices In Year 12 (8 parpar) $5.81 $15.37 Footwear Production and Sales North Europe Asia Latin Average America Africa Pacific America or Total Notes Superior Materials Usage 47% 56% 63% 53% 6 usage up 10.5 points from Year 11. Utilization of Production Capability 114.7% 0.0% 111.4% 115.0% 113.1% % usage down 0.2 points from Year 11. Branded - Pairs Available (DOOs 31,817 23,704 19.807 19,613 94,941 18.7% higher than Year 12 demand. Demand - Forecast 24,687 20,648 16,727 16,727 78,789 From page 4 of FIR for Year 11. (DODa of pairs) Actual 25,200 20,880 16.956 16,965 80,001 Actual branded demand was 1.5% higher than forecast branded demand due to Pairs Sold (interat + wh 25,202 20,879 16.955 16,967 80,003 increased competitive intensity. Stockouts - No. of Companies Extent to which orders for branded pairs went unfilled due to inventory shortages al Unfilled Orders (pors) one or more companies. Private - Demand Forecast (0ODs of pairs) 2,214 2,214 2.295 2,295 9,018 From page 4 of FIR for Year 11. Label Pairs Offered (poos) 2,610 2,287 2.861 2,300 10,058 Private label pairs offered was higher than Pairs Sold (0ODs) 2,166 2.214 2 216 2,243 8,839 actual private label demand by 10.3% Demand Forecast North Europe Asla Latin Global America Africa Pacific America Total Notes Branded Demand Year 13 26,706 22,167 18,656 18,692 86,221 Global demand for Y11-Y15 is expected to grow Inlemet + wholesaler Year 14 28,309 23,498 20.524 20,564 92,895 by 76-8%_annually, slowing to 6%-7% during Year 15 30,008 24,912 22.580 22,623 100,123 Y16-Y20. The projected growth rates are not the same for all regions, as shown in the table Private-Label Demand Year 13 2,457 2,457 2.592 2,592 10,098 on page $ of the Player's Guide. Actual demand Year 14 2,727 2,727 2.925 2,925 11,304 growth may vary from the forecast due to 3,024 3,024 3.303 3,303 12,654 stronger or weaker competitive efforts on the Year 15 part of rival companies. Supply / Demand Analysis Potential Footwear Suppy in Year 13 Expected Footwear Demand in Year 13 Analysis Beginning Year 13 Inventory 14.938 Branded Demand Forecast 86.221 Potential global supply (at max OT) in the upcoming Potential Y13 Production (with OT) 105,600 Private-Label Demand Forecast 10.098 year is 25.1% greater than projected global demand. This much excess potential "supply is certain to Potential Global Supply 120.538 Expected Global Demand 96,319 greatly intensify competition for the next few years and reduce industry profitability. It is advisable to NOT add more production capability at this time. Facility Space Production Equipment Year 12 Facility Space Construction of New Space Total Year 12 Production Equipment 1000s of pairs available for pred. aquipmart) (Initiated in Y12 and available in Y13) Space 1000a of pairs inallable for production) N.A. E-A A-P L.A. N.A. E-A A-P L.A. Available N.A. E-A A-P Total in Y13 5,000 6,000 2,000 13,000 4.000 4,000 2,000 10,000 5,000 6,000 0 11,000 4.000 4.00 0 0 8,000 5,000 6,000 4,000 15.000 5.000 6.000 0 11,000 6,000 6,000 0 12,000 3.750 4.000 7,750 HIGTMOnAS 3900 0800 13,000 4,500 0 5.250 9,750 00 0600 00 0 00006080 0 HIQTmong 5,000 6,000 1,000 1,000 00 0808080 00 00 0080 5,000 6,000 4,000 2,000 17,000 3.750 0 5.750 4,000 13,500 9,000 11,000 20,000 4,750 0 4,750 9,500 5,000 7,000 12.000 4,000 0 4.000 8,000 5,000 6,000 11,000 5,000 0 5.500 10,500 50,000 0 60,000 11,000 1,000 2,000 124,000 38,750 43,250 6.000 88,0001/19/23, 2:06 PM BSG Decisions & Reports Champion Wear DISTRIBUTION AND WAREHOUSE Year 12 (Industry 18) (projected) (practice WAREHOUSE OPERATIONS (branded) North America Europe-Africa Asia-Pacific Latin America Total All pair figures in thousands. Pairs Models S/Q Pairs Models S/Q Pairs Models S/Q Pairs Models S/Q Pairs Ending Inventory from Year 11 245 349 6.2* 215 349 6.3* 149 349 6.5* 201 349 6.5* 810 Inventory Clearance (at the beginning of Y12) 0 0 0 0 0 Beginning Year 12 Inventory 245 349 6.2 215 349 6.3 149 349 6.5 201 6.5 810 Incoming Year 12 - North America Facility | 3,560 100 6.8 1,857 100 6.8 0 0 0.0 0 0.0 5,417 Shipments from Europe-Africa Facility 0 0.0 0 0 0.0 0 0.0 0 0.0 Asia-Pacific Facility 0 0.0 1,386 150 7.5 2,234 150 7.5 2,290 150 7.5 5,910 Latin America Facility 0.0 0 0.0 0 0 0.0 0 0.0 Pairs Available for Sale in Year 12 3.805 116 6.8* 3,458 136 7.0* 2,383 163 7.4* 2,491 166 7.4* 12,137 Pairs Sold Internet Segment 462 462 Actual 409 409 Actual 339 339 Actual 346 346 Actual 1,556 Wholesale Segment 3,218 3,218 Branded 2,919 2,919 Branded 1,947 1,947 Branded 2,045 2,045 Branded 10,129 Total Branded Sales 3,680 3,680 Demand 3,328 3,328 Demand 2,286 2,286 Demand 2.391 2.391 Demand 11,685 Required Inventory (needed to achieve delivery time) 107 106 80 84 377 Inventory Surplus (Shortfall) 18 24 17 16 75 Ending Year 12 Inventory (unsold pairs) 125 116 6.8* 136 7.0* 97 163 7.4* 100 166 7.4* 452 COST OF BRANDED PAIRS SOLD North America Europe-Africa Asia-Pacific Latin America Total $000s $/Pair $000s $/Pair $000s $/Pair $000s $/Pair $000s $/Pair Cost of Beginning Year 12 Inventory 7,521 2.04 7,884 2.37 4,212 1.84 7.894 3.30 27,511 2.35 + Production Cost of Incoming Pairs 99,257 26.97 38,416 26.57 59,067 25.84 60,552 25.32 307,292 26.30 Exchange Rate Cost Adjustments 0 0.00 -5.123 -1.54 0 0.00 3,609 -1.51 -8,732 -0.75 + Freight on Incoming Pairs 3,560 0.97 6,486 1.95 2,234 0.98 4,580 1.92 16,860 1.44 + Import Tariffs on Incoming Pairs 0 0.00 19,458 5.85 0 0.00 22,900 9.58 42,358 3.62 - Cost of Ending Year 12 Inventory 3,625 0.99 4,403 1.32 2,667 1.17 3,706 1.55 14,401 1.23 Cost of Branded Pairs Sold in Year 12 106,713 29.00 112,718 33.87 62,846 27.49 88,611 37.06 370,888 31.74 WAREHOUSE EXPENSES North America Europe-Africa Asia-Pacific Latin America Total SOOOs $/Pair $000s $/Pair $000s $/Pair $000s S/Pair $000s $/Pair Inventory Storage Costs (on Y11 carried over 128 0.03 115 0.03 79 0.03 129 0.05 451 0.04 Packaging/Shipping Costs - Internet 5,844 1.59 5,174 1.55 4,288 1.88 4,377 1.83 19,683 1.68 Wholesale 10,919 2.97 10,195 3.06 7,133 3.12 7,442 3.11 35,689 3.05 Warehouse Lease and Maintenance 1,000 0.27 1,000 0.30 1,000 0.44 1,000 0.42 4,000 0.34 Total Warehouse Operating Expenses 17,891 4.86 16,484 4.95 12,500 5.47 12,948 5.42 59,823 5.12 INVENTORY CLEARANCE North America Europe-Africa Asia-Pacific Latin America Total SOOOs $/Pair $000s $/Pair SOOOs S/Pair $000s S/Pair $000s $/Pair Gross Revenues from Pairs Cleared 0 0.00 0.00 0.00 0 0.0 0 0.00 + Exchange Rate Cost Adjustments 0 0.00 0 0.00 0.00 0.00 0 0.00 Net Revenues from Pairs Cleared 0 0.00 Ol 0.00 0.00 0.00 0.00 Direct Costs - Production / Freight / Tariffs 0 0.00 0 0.00 0.00 0.00 0 0.00 olooo ol Inventory Storage 0.00 0.00 0.00 0.00 0.00 Packaging / Shipping 0.00 0 0.00 0.00 0.00 loo 0.00 Margin Over Direct Costs 0.00 0 0.00 0.00 0.00 0.00 Company Operating Reports Copyright @ GLO-BUS Software, Inc. Printed 19-Jan-23 at 2:06 PM - Page 3 https://www.bsg-online.com/users/program/v3/cor/financials 3/71/19/23, 2:06 PM BSG Decisions & Reports Champion Wear PRIVATE-LABEL OPERATIONS Year 12 (Industry 18) (projected) (practice) CONTRACT OFFERS North America Europe-Africa Asia-Pacific Latin America Total Offers to Private Offer Price ($ per pair) 35.00 37.00 30.00 40.00 Label Buyers Pairs Offered (000s) 443 pairs 246 pairs 453 pairs 453 pairs 1,595 pairs S/Q Rating 5.2* 5.7* 5.8* 5.8* Number of Models 100 100 100 100 Offer Accepted / Declined Accepted Accepted Accepted Accepted Pairs Produced / Sold (000s) 443 pairs 246 pairs 453 pairs 453 pairs 1,595 pairs Europe-Africa Asia-Pacific Latin America Total PRODUCTION AND SHIPPING North America Facility Facility Facility Facility $000s $/Pair $000s $/Pair $000s $/Pair $000s S/Pair $000s $/Pair Production - Materials Costs 3,714 7.55 0 0.00 8,246 7.48 0.00 11,960 7.50 Costs Labor Costs 5,972 12.14 0.00 7,112 6.45 0.0 13,084 8.20 Best Practices Training 94 0.19 0.00 1,743 1.58 0.00 1,837 1.15 Supervisory Costs 109 0.22 0.00 139 0.13 0.00 248 0.16 Enhanced Styling / Features 1,000 2.03 0.00 2,000 1.81 0.00 3,000 1.88 TQM/6-Sigma Program 2,500 5.08 0.00 5.600 5.08 0.00 B,100 5.08 Production Run Setup 250 0.51 0 0.00 500 0.45 ood 0.00 750 0.47 Facilities Maintenance 297 0.60 0 0.00 756 0.69 0.00 1,053 0.66 Depreciation Expense 1,120 2.28 0 0.00 2,030 1.84 0 0.00 3,150 1.97 Total Production Costs 15,056 30.60 0.00 28,126 25.50 0 0.00 43,182 27.07 Private-Label Regular-Time Pairs 0 pairs pairs 0 pairs 0 pairs pairs Production Overtime Pairs 500 0 1,120 0 1,620 (000s of pairs) Rejected Pairs -8 (1.5%) -0 (0.0%) -17 (1.5%) -0 (0.0%) -25 (1.5%) Net Production 492 pairs 0 pairs 1,103 pairs 0 pairs 1,595 pairs Shipments To N.A. Warehouse 443 pairs 0 pairs 0 pairs pairs 443 pairs (000s of pairs) E-A Warehouse 49 0 197 246 A-P Warehouse 0 453 0 453 L.A. Warehouse 0 pairs 0 pairs 453 pairs 0 pairs 453 pairs REVENUES / COSTS / MARGINS North America Europe-Africa Asia-Pacific Latin America Total $000s $/Pair $000s $/Pair $000s $/Pair $000s S/Pair $000s $/Pair Gross Private-Label Revenues 15,505 35.00 9,102 37.00 13,590 30.00 18,120 40.0 56,317 35.31 Exchange Rate Adjustments 15,505 35.00 786 3.20 898 1.98 2,272 5.02 3,956 2.48 Net Private-Label Revenues 13,556 30.60 9,888 40.20 14,488 31.98 20,392 45.02 60,273 37.79 Direct Production Costs 0.00 6,523 26.52 11,552 25.50 11.552 25.50 43,183 27.07 Costs + Exchange Rate Adjustments 443 1.00 -227 -0.92 0.00 -688 -1.52 -915 -0.57 Freight 0 0.00 492 2.00 453 1.00 906 2.00 2,294 1.44 Import Tariffs 509 1.15 1,476 6.00 0 0.00 4,530 10.00 6.006 3.77 Packaging / Shipping 997 2.25 283 1.15 521 1.15 521 1.15 1,834 1.15 Margin Over Direct Costs 1,341 5.45 1,962 4.33 3,571 7.88 7,871 4.93 Company Operating Reports Copyright @ GLO-BUS Software, Inc. Printed 19-Jan-23 at 2:06 PM - Page 5 5/7 https://www.bsg-online.com/users/program/v3/cor/financials