Answered step by step
Verified Expert Solution
Question
1 Approved Answer
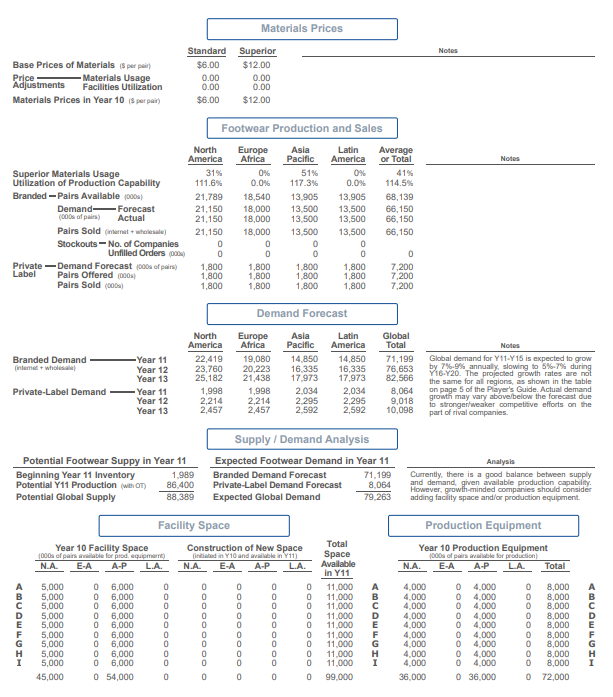
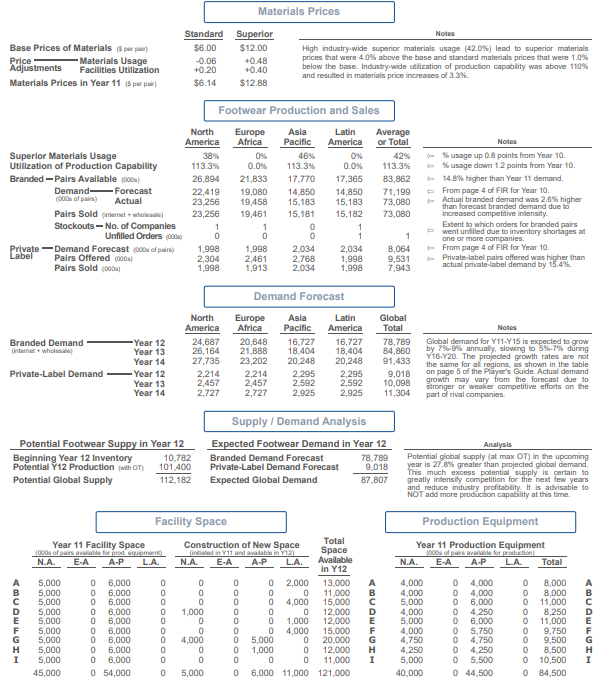
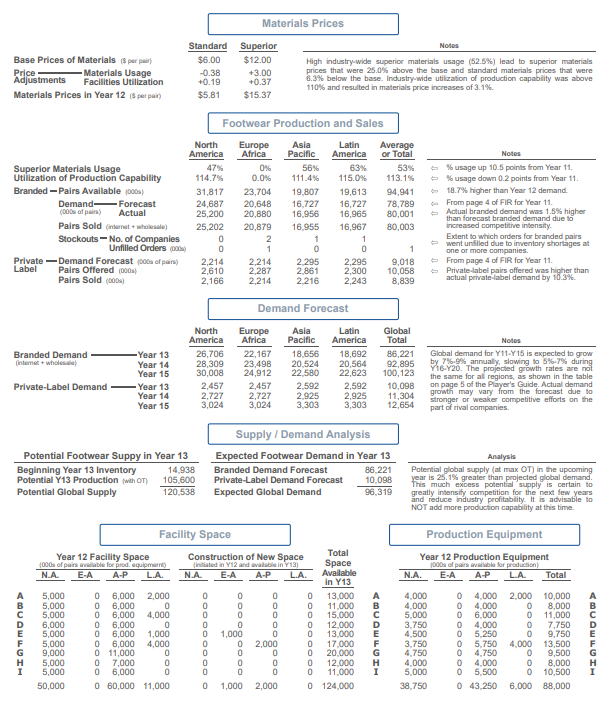
Please Fill in the boxes the references are provided below Market Share % = Company Units Sold/Total Units Sold in the market X 100 Y10
Please Fill in the boxes the references are provided below
Market Share % = Company Units Sold/Total Units Sold in the market X 100
| Y10 | Y11 | Y12 | ||
| Market Share (based on pairs) % |
Y10
Y11
Y12


 Materials Prices Standard Superior Notes Base Prices of Materials ($ par pair) $6.00 $12.00 Price - Materials Usage 0.DO 0.DO Adjustments Facilities Utilization 0.00 0.00 Materials Prices in Year 10 (8 perpair) $6.00 $12.00 Footwear Production and Sales North Europe Asia Latin Average America Africa Pacific America or Total Notes Superior Materials Usage 31% 0% 51% 0% 41% Utilization of Production Capability 111.6% 0.0%% 117.3%% 0.0%% 114.5%% Branded - Pairs Available (poos) 21,789 18,540 13.905 13,905 68,139 Demand - Forecast 21,150 18,000 13,500 13,500 66,150 (000s of pairs) Actual 21,150 18,000 13.500 13,500 66, 150 Pairs Sold (interat + wholesale) 21,150 18,000 13.500 13,500 66,150 Stockouts - No. of Companies Unfilled Orders (poks) Private - Demand Forecast (DOOs of pairs) 1,800 1,800 1.800 1,800 7,200 Label Pairs Offered (poos) 1,800 1,800 1,800 1,800 7,200 Pairs Sold (DODs) 1,800 1,800 1.80 0 1,800 7,200 Demand Forecast North Europe Asla Latin Global America Africa Pacific America Total Branded Demand -Year 11 22,419 19,080 14.850 14,850 71,199 Global demand for Y11-Y 15 is expected to grow [niemet + wholesale) Year 12 23,760 20,223 16.335 16,335 76,653 by 716-9% annually, slowing to 6%-7%% during Year 13 25,182 21,438 17.973 17,973 82,566 Y16-Y20. The projected growth rates are not the same for all regions, as shown in the table Private-Label Demand - - Year 11 1,898 1,998 2.034 2,034 8,064 on page $ of the Player's Guide. Actual demand Year 12 2.214 2.214 2.295 2,295 9.018 growth may vary above/below the forecast due Year 13 2.457 2,457 2,592 to stronger/weaker competitive efforts on the 2.592 10,098 part of rival companies. Supply / Demand Analysis Potential Footwear Suppy in Year 11 Expected Footwear Demand in Year 11 Analysis Beginning Year 11 Inventory 1.989 Branded Demand Forecast 71.199 Currently, there is a good balance between supply Potential Y11 Production (with OT) 86.400 Private-Label Demand Forecast 8.064 and demand, given available production capability. However, growth-minded companies should consider Potential Global Supply 88.389 Expected Global Demand 79.263 adding facility space andfor production equipment. Facility Space Production Equipment Construction of New Space Total Year 10 Facility Space Year 10 Production Equipment 1000s of pairs available for plead. equipment) [initiated in Y10 and available in v11) Space 1000% of pairs inallable for production) N.A. E-A A-P L.A. N.A. E-A A-P L.A. Available N.A. E-A A-P L.A. Total in Y11 5,000 6,000 11,000 4,000 4,000 8,000 5,000 6,000 11.000 4.000 4.000 8,DO0 5,000 6,000 11.00 0 4.000 4.00 0 8,000 5,000 6,000 11.000 4.DOO 4.000 8,000 HIGTMOnD> 5,000 090900909 6,000 11.000 4.000 4.000 8,000 00 00 00 009 90 00 08000 00 00 08090 00 0080000 0 00 0808000 5,000 6,000 11,000 4.00 0 8,000 5,000 6,000 11,000 4.000 4.00 0 8,000 5,000 6,000 11,000 4,000 4.000 8,000 5,000 6,000 11,000 4.000 4,00 0 8,000 45,000 0 54,000 89.000 36,000 0 36.000 72,000Materials Prices Standard Superior Notes Base Prices of Materials ($ par pair) $6.00 $12.00 High industry wide superior materials usage (42.0%%) lead to superior materials Price prices that were 4.0% above the base and standard materials prices that were 1.0% Materials Usage 0.06 +0.48 Adjustments Facilities Utilization +0.20 +0.40 below the base. Industry wide utilization of production capability was above 110%% and resulted in materials price increases of 3.3%%. Materials Prices in Year 11 ($ par par) $6.14 $12.88 Footwear Production and Sales North Europe Asia Latin Average America Africa Pacific America or Total Notes Superior Materials Usage 38% 46% 42% usage up 0.8 points from Year 10. Utilization of Production Capability 113.3%% 0.0%% 113.3%% 1.0% 113.3% % usage down 1.2 points from Year 10. Branded - Pairs Available (DODs) 26,894 21,833 17.770 17,365 83,862 14.8% higher than Year 11 demand Demand- - Forecast 22,419 19,080 14,850 14,850 71,198 From page 4 of FIR for Year 10. (000s of pairs) Actual 23,256 19,458 15.183 15,183 73,080 Actual branded demand was 2.6%% higher than forecast branded demand due to Pairs Sold (interat + wholesale) 23,256 19,461 15,181 15,182 73,080 increased competitive intensity. Stockouts - No. of Companies Extent to which orders for branded pairs went unfilled due to inventory shortages a Unfilled Orders (pods) one or more companies. Private - Demand Forecast (DOOs of pairs) 866'L 1,998 2.034 2,034 3,064 From page 4 of FIR for Year 10. Label Pairs Offered jpoos 2,304 2,461 2.768 368 9,531 Private label pairs offered was higher than Pairs Sold (DODs) 1,998 1,913 2.034 1,998 7,943 actual private label demand by 15.4%. Demand Forecast North Europe Asia Latin Global America Africa Pacific America Total Notes Branded Demand -Year 12 24,687 20,648 16,727 16,727 78,789 Global demand for Y11-Y 15 is expected to grow [inlamet + wholesale) Year 13 26,164 21,888 18.404 18,404 84,860 by 7-9% annually, slowing to 616-7% during Year 14 27,735 23,202 20 248 20,248 91,433 Y16-Y20. The projected growth rates are not s. as shown in the table Private-Label Demand -Year 12 2,214 2.214 2 295 2,295 9,018 on page s of the Player's Guide. Actual demand 2,457 2,457 2.592 2,582 10,098 growth may vary from the forecast due to Year 13 Stronger or weaker competitive efforts on the Year 14 2,727 2,727 2 925 2.925 11,304 part of rival companies. Supply / Demand Analysis Potential Footwear Suppy in Year 12 Expected Footwear Demand in Year 12 Analysis Beginning Year 12 Inventory 10,782 Branded Demand Forecast 78,789 Potential global supply (at max OT) in the upcoming Potential Y12 Production (with OT) 101,400 Private-Label Demand Forecast 9.018 year is 27.8%% greater than projected global demand. This much excess potential supply is certain to Potential Global Supply 112,182 Expected Global Demand 87 807 greatly intensify competition for the next few years and reduce industry profitability. It is advisable NOT add more production capability at this time. Facility Space Production Equipment Year 11 Facility Space Construction of New Space Total Year 11 Production Equipment 1030s of pairs available for pied equipmarty initiated in v11 and available in v12] Space 1000% of pairs innlabia for production NA. E-A A-P L.A. N.A. E-A A-P L.A. Available N.A. E-A A-P L.A. Total in Y12 5,000 0 6,000 2,000 13.000 4,000 4.000 8,000 5,000 0 6,000 0 11,000 4.000 0 4.000 8.000 5,000 0 6,000 4.000 15.000 5,000 0 6.000 11,000 5,000 6.000 1,000 12.000 4,000 0 4.250 8,250 5,000 6,000 0 1,000 12,000 5.000 0 6.000 0 11,000 HIATMOnA 00 00 08090 5,000 6,000 0 0 0 00 00800 0 0 4,000 15,000 4,000 0 5.750 0 9,750 5,000 099090 6,000 4.000 5,000 20,000 4,750 4.750 9,500 HINT 5,000 6,000 0 1.000 12,000 4.250 4.250 8,500 5,000 6,000 11,000 5.000 5.500 10,500 45,000 0 54,000 5,000 6,000 11,000 121,000 40.000 0 44.500 0 84,500Materials Prices Standard Superior Notes Base Prices of Materials ($ par pair) $6.00 $12.00 High industry-wide superior materials usage (52.60) lead to superior materials Price - Materials Usage -0.38 +3.00 prices that were 25.0% above the base and standard materials prices that were Adjustments Facilities Utilization +0.19 +0.37 8.3% below the base. Industry-wide utilization of production capability was above 110% and resulted in materials price increases of 3.1%. Materials Prices in Year 12 ($ parpair) $5.81 $15.37 Footwear Production and Sales North Europe Latin Average America Africa Pacific America or Total Notes Superior Materials Usage 47%% 56% 63% 53% * usage up 10.5 points from Year 11. Utilization of Production Capability 114.7% 0.0% 111.4%% 115.0% 113.1% 6 usage down 0.2 points from Year 11 Branded - Pairs Available jobs) 31,817 23,704 19.807 19,613 14,941 18.7%% higher than Year 12 demand. Demand - Forecast 24,687 20.648 16,727 16,727 78,789 From page 4 of FIR for Year 11. (DODs of pairs) Actual 25,200 20.880 16.956 16,965 80,001 Actual branded demand was 1.5%% higher than forecast branded demand due to Pairs Sold (internet + m 25,202 20,879 16,955 16,967 80,003 increase Stockouts - No. of Companies 0 Extent to which orders for branded pairs went unfilled due to inventory shortages at Unfilled Orders (pots) one or more companies. Private - Demand Forecast (DODs of pairs) 2,214 2,214 2.295 2,295 9,018 From page 4 of FIR for Year 11. Label Pairs Offered (poos) 2,610 2.287 2.861 2,300 10,058 Private label pairs offered was higher than Pairs Sold (DODs) 2,166 2,214 2.216 2,243 8,839 actual private label demand by 10.3% Demand Forecast North Europe Asia Latin Global America Africa Pacific America Total Notes Branded Demand Year 13 26,706 22,167 18.656 18,692 86,221 Global demand for Y11-Y 15 is expected to grow Inlemet + wholesale Year 14 28,309 23,498 20.524 20,564 92,895 by 716:8%_annually, slowing to 6%%-7% during 22.580 Y16-Y20. The projected growth rates are not Year 15 30,008 24,912 22,623 100,123 the same for all regions, as shown in the table Private-Label Demand Year 13 2,457 2.457 2.592 2,592 10,098 on page $ of the Player's Player's Guide. Actual demand Year 14 2,727 2,727 2.925 2,925 11,304 growth may vary from the forecast due to 3.303 3,303 stronger or weaker competitive efforts on the Year 15 3,024 3.024 12,654 part of rival companies. Supply / Demand Analysis Potential Footwear Suppy in Year 13 Expected Footwear Demand in Year 13 Analysis Beginning Year 13 Inventory 14,938 Branded Demand Forecast 86 221 Potential global supply (at max OT) in the upcoming Potential Y13 Production (with On) 105,600 Private-Label Demand Forecast 10,098 year is 25.1% greater than projected global demand. This much excess potential supply is certain to Potential Global Supply 120.538 Expected Global Demand 96.319 greatly intensify competition for the next few years and reduce industry profitability. It is advisable NOT add more production capability at this time. Facility Space Production Equipment Year 12 Facility Space Construction of New Space Total Year 12 Production Equipment (030% of pairs arvidable for pied. aquipmart) (initialed in W12 and available in Y'13) Space 1000% of pairs imailable for production) NA. E-A A-P L.A. N.A. E-A A-P L.A. Available N.A E-A A-P L.A. Total in Y13 5,000 6,000 2,000 13,000 4.000 4,000 2,000 10,000 5,000 6,000 0 11,000 4,000 0 4.00 8,000 5,000 6,000 4,000 15,000 5,000 0 6.000 0 11,000 6,000 6,000 0 12,000 3,750 0 4.000 0 7,750 5,000 6,000 1,000 1.000 13.000 HIGTMOnOP 4.500 0 5.250 0 9,750 HIATMONOS HIATMOnAP 000008080 00 00 0000 000000800 5,000 6,000 4,000 0 2,000 17,000 3.750 0 5.750 4.000 13,500 9,000 11,000 20,000 4.750 4,750 9.500 5,000 7,000 000 12.000 4,000 0 4,000 8,000 5,000 6,000 11.000 5,000 0 5.500 10,500 50,000 0 60,000 11,000 1,000 2,000 0 124,000 38,750 0 43.250 6.000 88,000
 Step by Step Solution
There are 3 Steps involved in it
Step: 1

Get Instant Access to Expert-Tailored Solutions
See step-by-step solutions with expert insights and AI powered tools for academic success
Step: 2

Step: 3

Ace Your Homework with AI
Get the answers you need in no time with our AI-driven, step-by-step assistance
Get Started


