Question: please fill out all the questions POSTLAB - ANALYZING VISIBLE WAVELENGTH UN PEN only to fill out this form, croxy out any mistakes with a


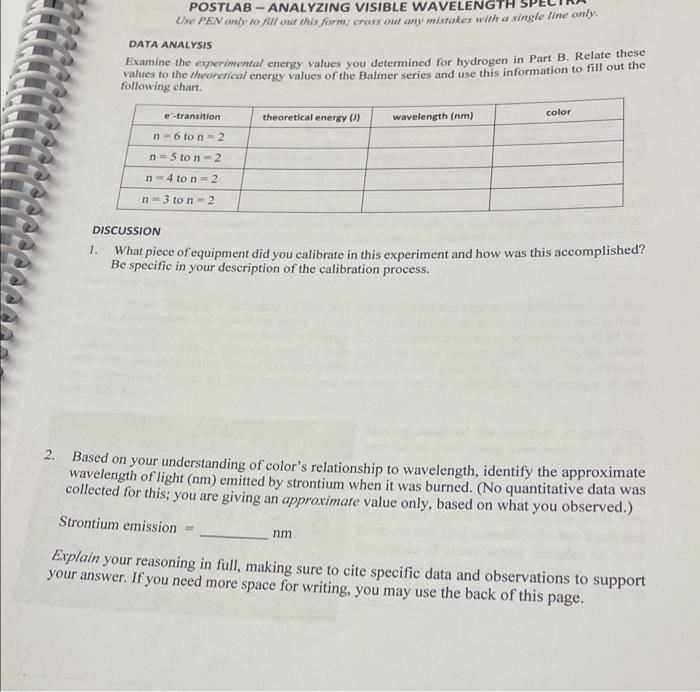
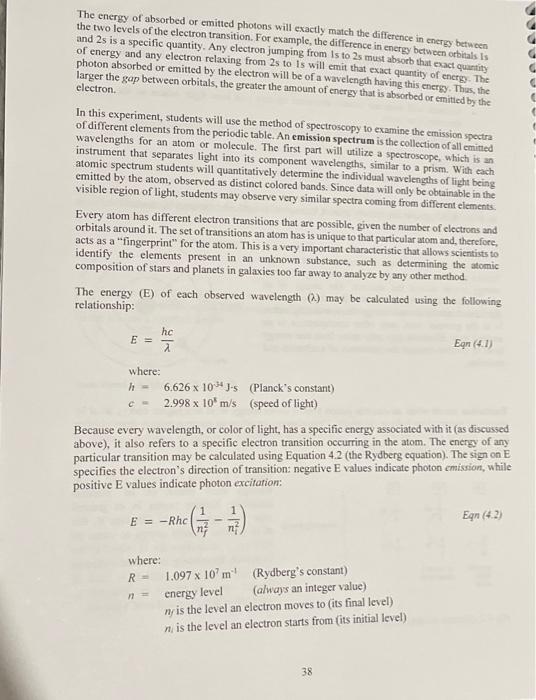
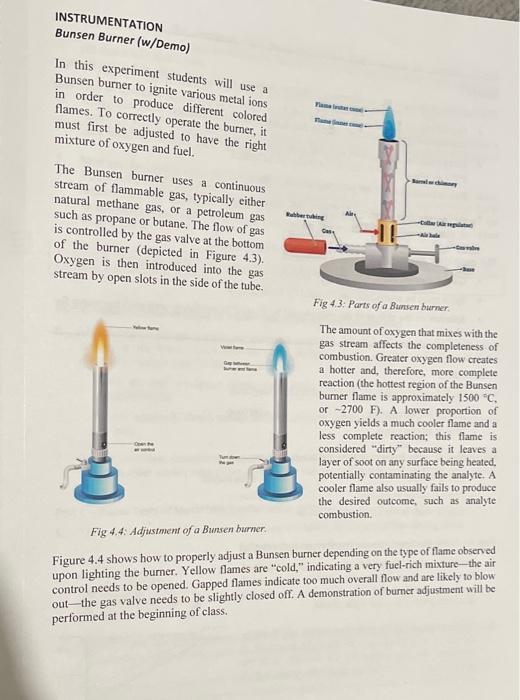
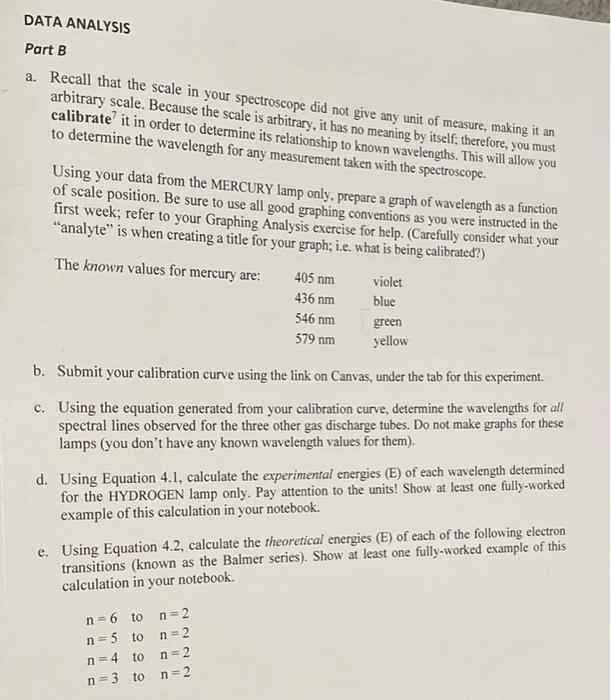
POSTLAB - ANALYZING VISIBLE WAVELENGTH UN PEN only to fill out this form, croxy out any mistakes with a single line only DATA ANALYSIS Examine the experimental energy values you determined for hydrogen in Part B. Relate these values to the theoretical energy values of the Balmer series and use this information to fill out the following chart theoretical energy ()) wavelength (nm) color e-transition n-6 to n - 2 n = 5 to n2 n-4to n2 n=3 ton - 2 DISCUSSION 1. What piece of equipment did you calibrate in this experiment and how was this accomplished? Be specific in your description of the calibration process. 2. Based on your understanding of color's relationship to wavelength, identify the approximate wavelength of light (nm) emitted by strontium when it was burned. (No quantitative data was collected for this, you are giving an approximate value only, based on what you observed.) Strontium emission nm Explain your reasoning in full, making sure to cite specific data and observations to support your answer. If you need more space for writing, you may use the back of this page. The energy of absorbed or emitted photons will exactly match the difference in energy between the two levels of the electron transition. For example, the difference in energy between orbitals and 2s is a specific quantity. Any electron jumping from Is to 2s must absorb that cact quantity of energy and any electron relaxing from 2s to is will emit that exact quantity of energy. The photon absorbed or emitted by the electron will be of a wavelength having this energy. Thus, the larger the gap between orbitals, the greater the amount of energy that is absorbed or emitted by the electron In this experiment, students will use the method of spectroscopy to examine the emission spectra of different elements from the periodic table. An emission spectrum is the collection of all emitted wavelengths for an atom or molecule. The first part will utilize a spectroscope, which is an instrument that separates light into its component wavelengths, similar to a prism. With each atomic spectrum students will quantitatively determine the individual wavelengths of light being emitted by the atom, observed as distinct colored bands. Since data will only be obtainable in the visible region of light, students may observe very similar spectra coming from different elements, Every atom has different electron transitions that are possible, given the number of electrons and orbitals around it. The set of transitions an atom has is unique to that particular atom and therefore, acts as a "fingerprint for the atom. This is a very important characteristic that allows scientists to identify the elements present in an unknown substance, such as determining the atomic composition of stars and planets in galaxies too far away to analyze by any other method The energy (E) of each observed wavelength @) may be calculated using the following relationship: hc Egr (41) EE 2 where: 6.626 x 1054.Js (Planck's constant) 2.998 x 10 m/s (speed of light) Because every wavelength, or color of light, has a specific energy associated with it (as discussed above), it also refers to a specific electron transition occurring in the atom. The energy of any particular transition may be calculated using Equation 4.2 (the Rydberg equation). The sign on E specifies the electron's direction of transition: negative E values indicate photon emission, while positive E values indicate photon excitation: 1 1 E = -Rhc Egn (4.2) where: R= 1.097 x 10m (Rydberg's constant) energy level (always an integer value) n/is the level an electron moves to (its final level) n is the level an electron starts from its initial level) 38 INSTRUMENTATION Bunsen Burner (w/Demo) In this experiment students will use a Bunsen bumer to ignite various metal ions in order to produce different colored flames. To correctly operate the bumer, it must first be adjusted to have the right mixture of oxygen and fuel. The Bunsen burner uses a continuous stream of flammable gas, typically either natural methane gas, or a petroleum gas such as propane or butane. The flow of gas is controlled by the gas valve at the bottom of the burner (depicted in Figure 4.3). Oxygen is then introduced into the gas stream by open slots in the side of the tube. . Martin - Fig 4.3: Parts of a Bunsen burner. The amount of oxygen that mixes with the gas stream affects the completeness of combustion. Greater oxygen flow creates a hotter and, therefore, more complete reaction (the hottest region of the Bunsen burner flame is approximately 1500 C, or -2700 F). A lower proportion of oxygen yields a much cooler flame and a less complete reaction; this flame is considered "dirty" because it leaves a layer of soot on any surface being heated. potentially contaminating the analyte. A cooler flame also usually fails to produce the desired outcome, such as analyte combustion Fig 4.4. Adjustment of a Bunsen burner Figure 4.4 shows how to properly adjust a Bunsen burner depending on the type of flame observed upon lighting the bumer. Yellow flames are "cold." indicating a very fuel-rich mixture-the air control needs to be opened. Gapped flames indicate too much overall flow and are likely to blow out-the gas valve needs to be slightly closed off. A demonstration of burner adjustment will be performed at the beginning of class. DATA ANALYSIS Part B a. Recall that the scale in your spectroscope did not give any unit of measure, making it an arbitrary scale. Because the scale is arbitrary, it has no meaning by itself, therefore, you must calibrate it in order to determine its relationship to known wavelengths. This will allow you to determine the wavelength for any measurement taken with the spectroscope. Using your data from the MERCURY lamp only, prepare a graph of wavelength as a function of scale position. Be sure to use all good graphing conventions as you were instructed in the first week; refer to your Graphing Analysis exercise for help. (Carefully consider what your "analyte is when creating a title for your graph; i.e. what is being calibrated?) The known values for mercury are: 405 nm violet 436 nm blue 546 nm 579 nm green yellow b. Submit your calibration curve using the link on Canvas, under the tab for this experiment. c. Using the equation generated from your calibration curve, determine the wavelengths for all spectral lines observed for the three other gas discharge tubes. Do not make graphs for these lamps (you don't have any known wavelength values for them). d. Using Equation 4.1, calculate the experimental energies (E) of each wavelength determined for the HYDROGEN lamp only. Pay attention to the units! Show at least one fully-worked example of this calculation in your notebook. e. Using Equation 4.2, calculate the theoretical energies (E) of each of the following electron transitions (known as the Balmer series). Show at least one fully-worked example of this calculation in your notebook. n=6 to n=2 n=5 to n=2 n=4 to n=3 to n=2 n=2 POSTLAB - ANALYZING VISIBLE WAVELENGTH UN PEN only to fill out this form, croxy out any mistakes with a single line only DATA ANALYSIS Examine the experimental energy values you determined for hydrogen in Part B. Relate these values to the theoretical energy values of the Balmer series and use this information to fill out the following chart theoretical energy ()) wavelength (nm) color e-transition n-6 to n - 2 n = 5 to n2 n-4to n2 n=3 ton - 2 DISCUSSION 1. What piece of equipment did you calibrate in this experiment and how was this accomplished? Be specific in your description of the calibration process. 2. Based on your understanding of color's relationship to wavelength, identify the approximate wavelength of light (nm) emitted by strontium when it was burned. (No quantitative data was collected for this, you are giving an approximate value only, based on what you observed.) Strontium emission nm Explain your reasoning in full, making sure to cite specific data and observations to support your answer. If you need more space for writing, you may use the back of this page. The energy of absorbed or emitted photons will exactly match the difference in energy between the two levels of the electron transition. For example, the difference in energy between orbitals and 2s is a specific quantity. Any electron jumping from Is to 2s must absorb that cact quantity of energy and any electron relaxing from 2s to is will emit that exact quantity of energy. The photon absorbed or emitted by the electron will be of a wavelength having this energy. Thus, the larger the gap between orbitals, the greater the amount of energy that is absorbed or emitted by the electron In this experiment, students will use the method of spectroscopy to examine the emission spectra of different elements from the periodic table. An emission spectrum is the collection of all emitted wavelengths for an atom or molecule. The first part will utilize a spectroscope, which is an instrument that separates light into its component wavelengths, similar to a prism. With each atomic spectrum students will quantitatively determine the individual wavelengths of light being emitted by the atom, observed as distinct colored bands. Since data will only be obtainable in the visible region of light, students may observe very similar spectra coming from different elements, Every atom has different electron transitions that are possible, given the number of electrons and orbitals around it. The set of transitions an atom has is unique to that particular atom and therefore, acts as a "fingerprint for the atom. This is a very important characteristic that allows scientists to identify the elements present in an unknown substance, such as determining the atomic composition of stars and planets in galaxies too far away to analyze by any other method The energy (E) of each observed wavelength @) may be calculated using the following relationship: hc Egr (41) EE 2 where: 6.626 x 1054.Js (Planck's constant) 2.998 x 10 m/s (speed of light) Because every wavelength, or color of light, has a specific energy associated with it (as discussed above), it also refers to a specific electron transition occurring in the atom. The energy of any particular transition may be calculated using Equation 4.2 (the Rydberg equation). The sign on E specifies the electron's direction of transition: negative E values indicate photon emission, while positive E values indicate photon excitation: 1 1 E = -Rhc Egn (4.2) where: R= 1.097 x 10m (Rydberg's constant) energy level (always an integer value) n/is the level an electron moves to (its final level) n is the level an electron starts from its initial level) 38 INSTRUMENTATION Bunsen Burner (w/Demo) In this experiment students will use a Bunsen bumer to ignite various metal ions in order to produce different colored flames. To correctly operate the bumer, it must first be adjusted to have the right mixture of oxygen and fuel. The Bunsen burner uses a continuous stream of flammable gas, typically either natural methane gas, or a petroleum gas such as propane or butane. The flow of gas is controlled by the gas valve at the bottom of the burner (depicted in Figure 4.3). Oxygen is then introduced into the gas stream by open slots in the side of the tube. . Martin - Fig 4.3: Parts of a Bunsen burner. The amount of oxygen that mixes with the gas stream affects the completeness of combustion. Greater oxygen flow creates a hotter and, therefore, more complete reaction (the hottest region of the Bunsen burner flame is approximately 1500 C, or -2700 F). A lower proportion of oxygen yields a much cooler flame and a less complete reaction; this flame is considered "dirty" because it leaves a layer of soot on any surface being heated. potentially contaminating the analyte. A cooler flame also usually fails to produce the desired outcome, such as analyte combustion Fig 4.4. Adjustment of a Bunsen burner Figure 4.4 shows how to properly adjust a Bunsen burner depending on the type of flame observed upon lighting the bumer. Yellow flames are "cold." indicating a very fuel-rich mixture-the air control needs to be opened. Gapped flames indicate too much overall flow and are likely to blow out-the gas valve needs to be slightly closed off. A demonstration of burner adjustment will be performed at the beginning of class. DATA ANALYSIS Part B a. Recall that the scale in your spectroscope did not give any unit of measure, making it an arbitrary scale. Because the scale is arbitrary, it has no meaning by itself, therefore, you must calibrate it in order to determine its relationship to known wavelengths. This will allow you to determine the wavelength for any measurement taken with the spectroscope. Using your data from the MERCURY lamp only, prepare a graph of wavelength as a function of scale position. Be sure to use all good graphing conventions as you were instructed in the first week; refer to your Graphing Analysis exercise for help. (Carefully consider what your "analyte is when creating a title for your graph; i.e. what is being calibrated?) The known values for mercury are: 405 nm violet 436 nm blue 546 nm 579 nm green yellow b. Submit your calibration curve using the link on Canvas, under the tab for this experiment. c. Using the equation generated from your calibration curve, determine the wavelengths for all spectral lines observed for the three other gas discharge tubes. Do not make graphs for these lamps (you don't have any known wavelength values for them). d. Using Equation 4.1, calculate the experimental energies (E) of each wavelength determined for the HYDROGEN lamp only. Pay attention to the units! Show at least one fully-worked example of this calculation in your notebook. e. Using Equation 4.2, calculate the theoretical energies (E) of each of the following electron transitions (known as the Balmer series). Show at least one fully-worked example of this calculation in your notebook. n=6 to n=2 n=5 to n=2 n=4 to n=3 to n=2 n=2
Step by Step Solution
There are 3 Steps involved in it

Get step-by-step solutions from verified subject matter experts


