

Answered step by step
Verified Expert Solution
Question
1 Approved Answer
Please fill out Gannt Chart with the number of spaces in the image(12 spaces). Don't try to shorten the Gantt Chart 3. Consider the arrival
Please fill out Gannt Chart with the number of spaces in the image(12 spaces). Don't try to shorten the Gantt Chart
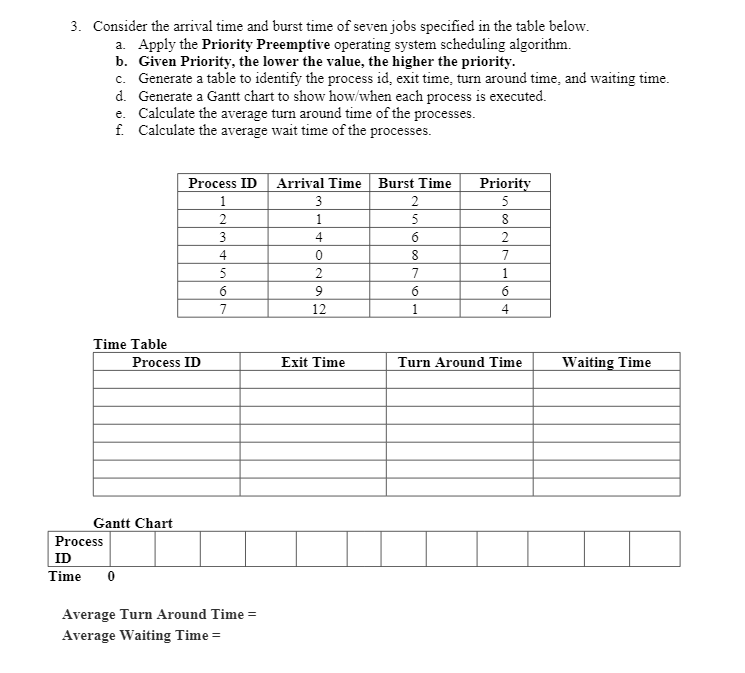
3. Consider the arrival time and burst time of seven jobs specified in the table below. a. Apply the Priority Preemptive operating system scheduling algorithm. b. Given Priority, the lower the value, the higher the priority. c. Generate a table to identify the process id, exit time, turn around time, and waiting time. d. Generate a Gantt chart to show how/when each process is executed. e. Calculate the average turn around time of the processes. f. Calculate the average wait time of the processes. Process ID 1 2 3 4 5 6 7 Arrival Time Burst Time 3 2 1 5 4 6 0 8 2 7 9 6 12 1 Priority 5 8 2 7 1 6 4 Time Table Process ID Exit Time Turn Around Time Waiting Time Gantt Chart Process ID Time 0 Average Turn Around Time = Average Waiting Time =Step by Step Solution
There are 3 Steps involved in it
Step: 1

Get Instant Access to Expert-Tailored Solutions
See step-by-step solutions with expert insights and AI powered tools for academic success
Step: 2

Step: 3
Ace Your Homework with AI
Get the answers you need in no time with our AI-driven, step-by-step assistance
Get Started
Object Databases The Essentials
Authors: Mary E. S. Loomis
1st Edition
020156341X, 978-0201563412