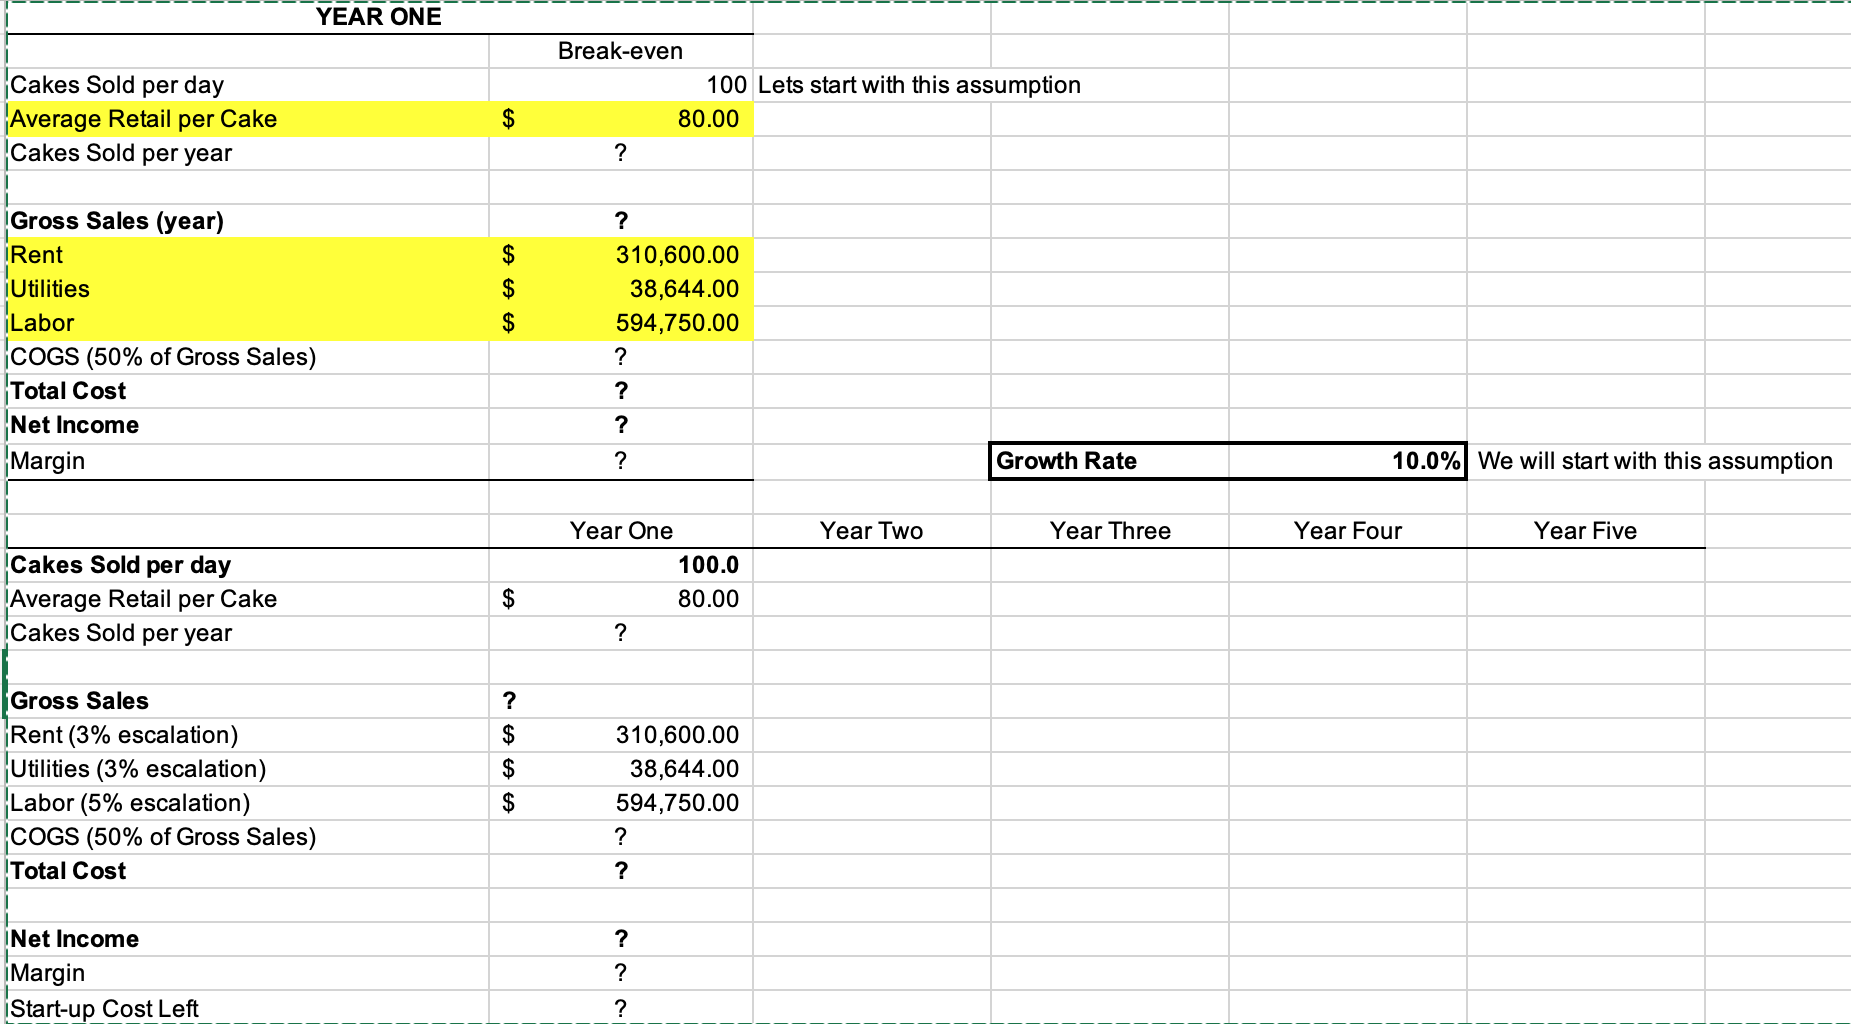
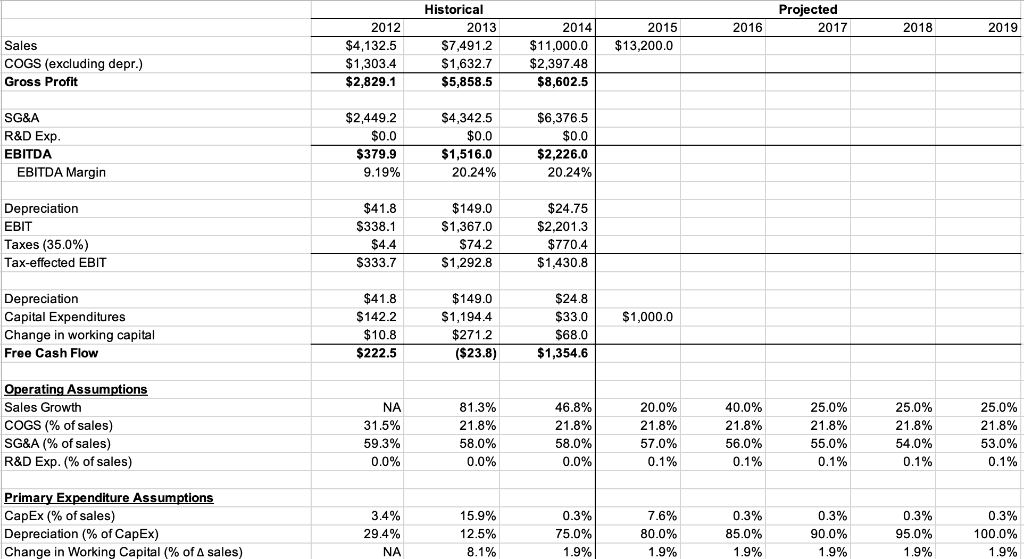
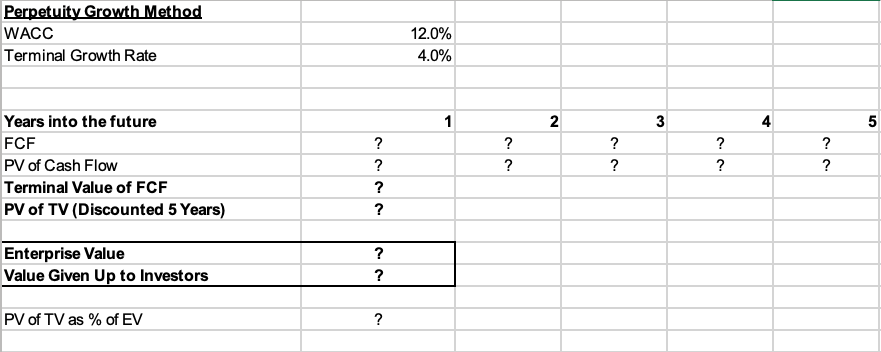
Please fill out the excel sheet below completely:


YEAR ONE Sales COGS (excluding depr.) Gross Profit SG\&A R\&D Exp. EBITDA EBITDA Margin Depreciation EBIT Taxes (35.0\%) Tax-effected EBIT \begin{tabular}{|r|r|r|} \hline$2,449.2 & $4,342.5 & $6,376.5 \\ \hline$0.0 & $0.0 & $0.0 \\ \hline $379.9 & $1,516.0 & $2,226.0 \\ \hline 9.19% & 20.24% & 20.24% \\ \hline \end{tabular} Depreciation Capital Expenditures Change in working capital Free Cash Flow \begin{tabular}{|r|r|r|r|r|r|} \hline$41.8 & $149.0 & $24.75 & \\ \hline$338.1 & $1,367.0 & $2,201.3 & \\ \hline$4.4 & $74.2 & $770.4 & & \\ \hline$333.7 & $1,292.8 & $1,430.8 & \\ \hline \end{tabular} Operating Assumptions Sales Growth COGS (\% of sales) SG\&A (\% of sales) R\&D Exp. (\% of sales) \begin{tabular}{|r|r|r|r|r|} \hline$41.8 & $149.0 & $24.8 & \\ \hline$142.2 & $1,194.4 & $33.0 & $1,000.0 & \\ \hline$10.8 & $271.2 & $68.0 & & \\ \hline$222.5 & ($23.8) & $1,354.6 & & \\ \hline \end{tabular} Primary Expenditure Assumptions CapEx (\% of sales) Depreciation (\% of CapEx) Change in Working Capital (\% of sales) \begin{tabular}{|r|r|r|r|r|r|r|r|r|} \hline NA & 81.3% & 46.8% & 20.0% & 40.0% & 25.0% & 25.0% & 25.0% \\ \hline 31.5% & 21.8% & 21.8% & 21.8% & 21.8% & 21.8% & 21.8% & 21.8% \\ \hline 59.3% & 58.0% & 58.0% & 57.0% & 56.0% & 55.0% & 54.0% & 53.0% \\ \hline 0.0% & 0.0% & 0.0% & 0.1% & 0.1% & 0.1% & 0.1% & 0.1% \\ \hline & & & & & & \\ \hline \end{tabular} Perpetuity Growth Method \begin{tabular}{l|r} \hline WACC & 12.0% \\ \hline Terminal Growth Rate & 4.0% \end{tabular} \begin{tabular}{|l|l|l|l|l|l|l|} \hline Years into the future & & & 2 & & 3 & \\ \hline FCF & ? & ? & ? & \\ \hline PV of Cash Flow & ? & ? & ? \\ \hline Terminal Value of FCF & ? & & ? \\ \hline PV of TV (Discounted 5 Years) & ? & & \\ \hline \end{tabular} Enterprise Value ? Value Given Up to Investors ? PV of TV as % of EV ? YEAR ONE Sales COGS (excluding depr.) Gross Profit SG\&A R\&D Exp. EBITDA EBITDA Margin Depreciation EBIT Taxes (35.0\%) Tax-effected EBIT \begin{tabular}{|r|r|r|} \hline$2,449.2 & $4,342.5 & $6,376.5 \\ \hline$0.0 & $0.0 & $0.0 \\ \hline $379.9 & $1,516.0 & $2,226.0 \\ \hline 9.19% & 20.24% & 20.24% \\ \hline \end{tabular} Depreciation Capital Expenditures Change in working capital Free Cash Flow \begin{tabular}{|r|r|r|r|r|r|} \hline$41.8 & $149.0 & $24.75 & \\ \hline$338.1 & $1,367.0 & $2,201.3 & \\ \hline$4.4 & $74.2 & $770.4 & & \\ \hline$333.7 & $1,292.8 & $1,430.8 & \\ \hline \end{tabular} Operating Assumptions Sales Growth COGS (\% of sales) SG\&A (\% of sales) R\&D Exp. (\% of sales) \begin{tabular}{|r|r|r|r|r|} \hline$41.8 & $149.0 & $24.8 & \\ \hline$142.2 & $1,194.4 & $33.0 & $1,000.0 & \\ \hline$10.8 & $271.2 & $68.0 & & \\ \hline$222.5 & ($23.8) & $1,354.6 & & \\ \hline \end{tabular} Primary Expenditure Assumptions CapEx (\% of sales) Depreciation (\% of CapEx) Change in Working Capital (\% of sales) \begin{tabular}{|r|r|r|r|r|r|r|r|r|} \hline NA & 81.3% & 46.8% & 20.0% & 40.0% & 25.0% & 25.0% & 25.0% \\ \hline 31.5% & 21.8% & 21.8% & 21.8% & 21.8% & 21.8% & 21.8% & 21.8% \\ \hline 59.3% & 58.0% & 58.0% & 57.0% & 56.0% & 55.0% & 54.0% & 53.0% \\ \hline 0.0% & 0.0% & 0.0% & 0.1% & 0.1% & 0.1% & 0.1% & 0.1% \\ \hline & & & & & & \\ \hline \end{tabular} Perpetuity Growth Method \begin{tabular}{l|r} \hline WACC & 12.0% \\ \hline Terminal Growth Rate & 4.0% \end{tabular} \begin{tabular}{|l|l|l|l|l|l|l|} \hline Years into the future & & & 2 & & 3 & \\ \hline FCF & ? & ? & ? & \\ \hline PV of Cash Flow & ? & ? & ? \\ \hline Terminal Value of FCF & ? & & ? \\ \hline PV of TV (Discounted 5 Years) & ? & & \\ \hline \end{tabular} Enterprise Value ? Value Given Up to Investors ? PV of TV as % of EV


