please fill out the yellow boxes
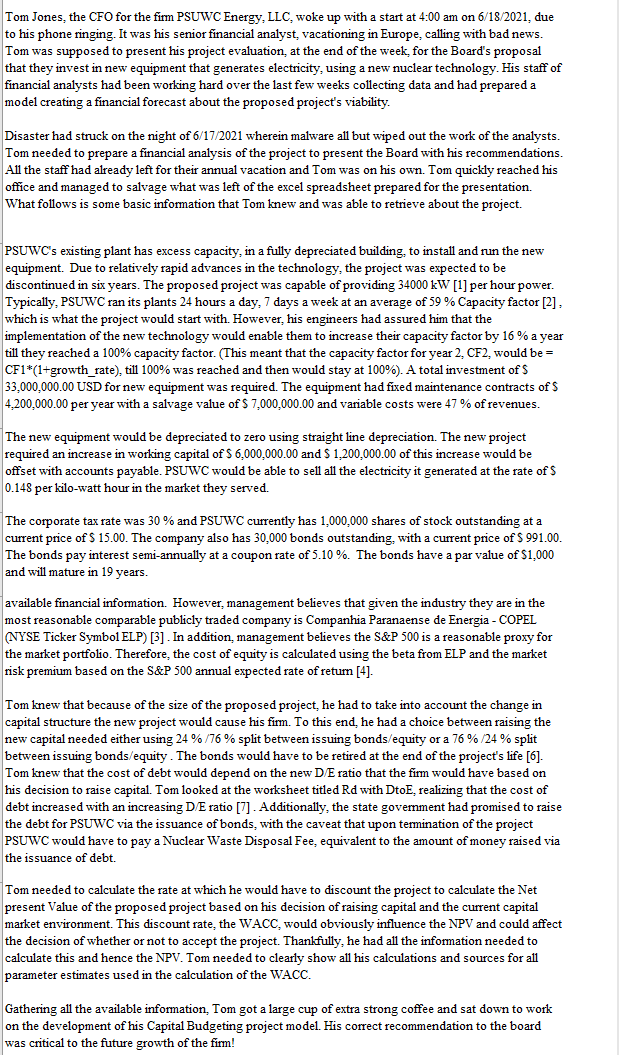
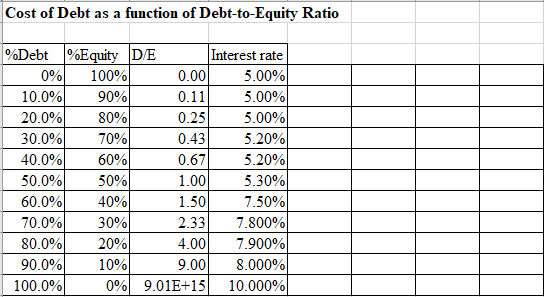
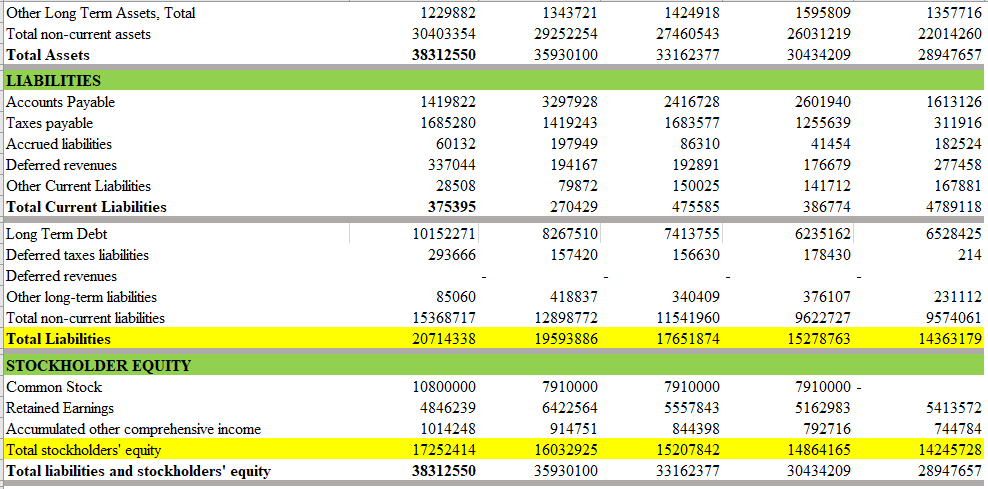
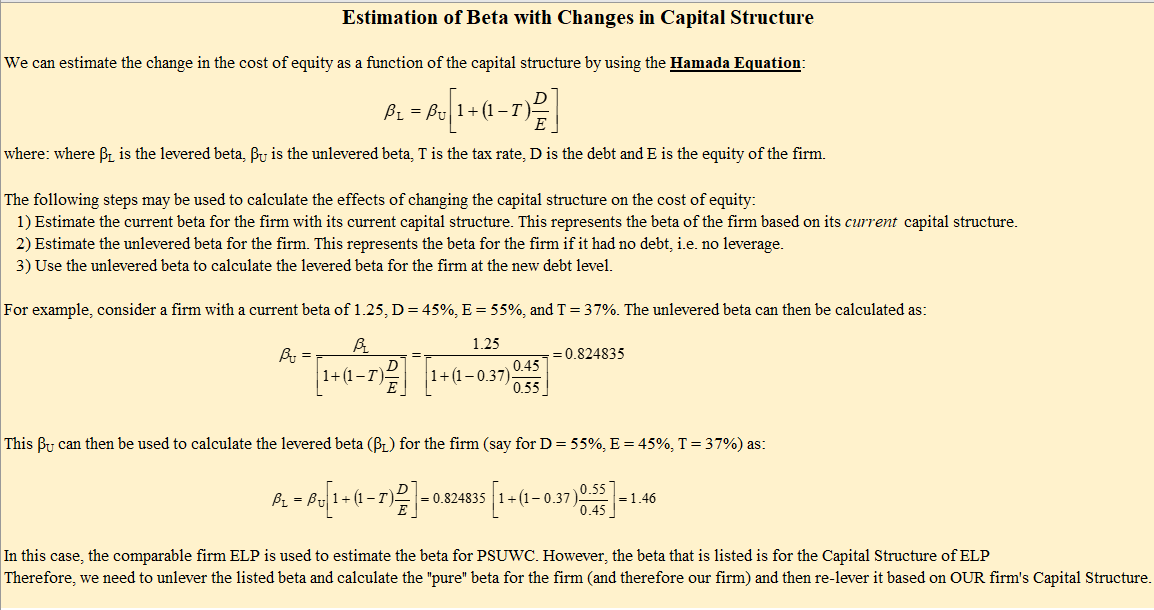
0.810% Economic life of project in years. Price of New Equipment Change in NWC $ 33,000,000.00 0.920 $ Besuwc (Re-levered) 6,000,000.00 4,200,000.00 Fixed Costs $ 47% Variable Costs (% of Revenue) Salvage value of New Equipment Marginal Tax Rate $ 7,000,000.00 30.0% 34000 kw per hour 59% Parameters Rm Original Debt Rf Original Equity BELP (From Yahoo!) New Debt BELP (Unlevered) New Equity Re Old D/E Ratio Rd New D/E Ratio New Wd % Raised via Bonds 24.0% New We % Raised via Equity 76.0% WACC Old Wd ELP Total Liabilities Old We ELP Total Stockholder Equity ELP D/E Ratio Note Cells C20 and C21 include the initial (today's) cash flows. Column D through I are the operating cash flows. Cells 138-141 contain the terminal cash flows. Generation First Year Capacity factor Capacity Factor Growth Rate Sale Price $ 16% 0.148 per kw-hour 991.00 Cost of Bonds $ Cost of Stock $ 15.00 Tom Jones, the CFO for the firm PSUWC Energy, LLC, woke up with a start at 4:00 am on 6/18/2021, due to his phone ringing. It was his senior financial analyst, vacationing in Europe, calling with bad news. Tom was supposed to present his project evaluation at the end of the week for the Board's proposal that they invest in new equipment that generates electricity, using a new nuclear technology. His staff of financial analysts had been working hard over the last few weeks collecting data and had prepared a model creating a financial forecast about the proposed project's viability. Disaster had struck on the night of 6/17/2021 wherein malware all but wiped out the work of the analysts. Tom needed to prepare a financial analysis of the project to present the Board with his recommendations. All the staff had already left for their annual vacation and Tom was on his own. Tom quickly reached his office and managed to salvage what was left of the excel spreadsheet prepared for the presentation. retrieve about the project. What follows is some basic information that Tom knew and was able PSUWC's existing plant has excess capacity, in a fully depreciated building, to install and run the new equipment. Due to relatively rapid advances in the technology, the project was expected to be discontinued in six years. The proposed project was capable of providing 34000 kW [1] per hour power. Typically, PSUWC ran its plants 24 hours a day, 7 days a week at an average of 59 % Capacity factor [2], which is what the project would start with. However, his engineers had assured him that the implementation of the new technology would enable them to increase their capacity factor by 16 % a year till they reached a 100% capacity factor. (This meant that the capacity factor for year 2, CF2, would be = CF1*(1+growth_rate), till 100% was reached and then would stay at 100%). A total investment of $ 33,000,000.00 USD for new equipment was required. The equipment had fixed maintenance contracts of 4,200,000.00 per year with a salvage value of $ 7,000,000.00 and variable costs were 47 % of revenues. The new equipment would be depreciated to zero using straight line depreciation. The new project required an increase in working capital of $ 6,000,000.00 and $ 1.200,000.00 of this increase would be offset with accounts payable. PSUWC would be able to sell all the electricity it generated at the rate of 0.148 per kilo-watt hour the market they served. The corporate tax rate was 30 % and PSUWC currently has 1,000,000 shares of stock outstanding at a current price of $ 15.00. The company also has 30,000 bonds outstanding, with a current price of $ 991.00. The bonds pay interest semi-annually at a coupon rate of 5.10 %. The bonds have a par value of $1,000 and will mature in 19 years. available financial information. However, management believes that given the industry they are in the most reasonable comparable publicly traded company is Companhia Paranaense de Energia - COPEL (NYSE Ticker Symbol ELP) [3] . In addition management believes the S&P 500 is a reasonable proxy for the market portfolio. Therefore, the cost of equity is calculated using the beta from ELP and the market risk premium based on the S&P 500 annual expected rate of return [4] Tom knew that because of the size of the proposed project, he had to take into account the change in capital structure the new project would cause his firm. To this end, he had a choice between raising the new capital needed either using 24 %/76% split between issuing bonds/equity or a 76 % /24 % split between issuing bonds/equity. The bonds would have to be retired at the end of the project's life [6]. Tom knew that the cost of debt would depend on the new D/E ratio that the firm would have based on his decision to raise capital. Tom looked at the worksheet titled Rd with Dto, realizing that the cost of debt increased with an increasing D/E ratio [7]. Additionally, the state government had promised to raise the debt for PSUWC via the issuance of bonds, with the caveat that upon termination of the project PSUWC would have to pay a Nuclear Waste Disposal Fee, equivalent to the amount money raised via the issuance of debt. Tom needed to calculate the rate at which he would have to discount the project to calculate the Net present Value of the proposed project based on his decision of raising capital and the current capital market environment. This discount rate, the WACC, would obviously influence the NPV and could affect the decision of whether or not to accept the project. Thankfully, he had all the information needed to calculate this and hence the NPV. Tom needed to clearly show all his calculations and sources for all parameter estimates used in the calculation of the WACC. Gathering all the available information, Tom got a large cup of extra strong coffee and sat down to work on the development of his Capital Budgeting project model. His correct recommendation to the board was critical to the future growth of the firm! Cost of Debt as a function of Debt-to-Equity Ratio %Debt%Equity D/E Interest rate 0% 100% 0.00 5.00% 10.0% 90% 0.11 5.00% 20.0% 80% 0.25 5.00% 30.0% 70% 0.43 5.20% 40.0% 60% 0.67 5.20% 50.0% 50% 1.00 5.30% 60.0% 40% 1.50 7.50% 70.0% 30% 2.33 7.800% 80.0% 20% 4.00 7.900% 90.0% 10% 9.00 8.000% 100.0% 0% 9.01E+15 10.000% 1343721 1424918 1595809 1357716 Other Long Term Assets. Total Total non-current assets Total Assets 1229882 30403354 29252254 27460543 26031219 22014260 38312550 35930100 33162377 30434209 28947657 1419822 3297928 2416728 2601940 1613126 1685280 1419243 1683577 1255639 311916 LIABILITIES Accounts Payable Taxes payable Accrued liabilities Deferred revenues Other Current Liabilities 60132 197949 86310 41454 182524 337044 194167 192891 176679 277458 28508 79872 150025 141712 167881 Total Current Liabilities 375395 270429 475585 386774 4789118 10152271 7413755 6235162 6528425 8267510 157420 293666 156630 178430 214 - Long Term Debt Deferred taxes liabilities Deferred revenues Other long-term liabilities Total non-current liabilities Total Liabilities 85060 418837 340409 376107 231112 15368717 12898772 11541960 9622727 9574061 20714338 19593886 17651874 15278763 14363179 10800000 7910000 7910000 7910000 - 4846239 6422564 5557843 5162983 5413572 STOCKHOLDER EQUITY Common Stock Retained Earnings Accumulated other comprehensive income Total stockholders' equity Total liabilities and stockholders' equity 1014248 914751 844398 792716 744784 17252414 16032925 15207842 14864165 14245728 38312550 35930100 33162377 30434209 28947657 Estimation of Beta with Changes in Capital Structure We can estimate the change in the cost of equity as a function of the capital structure by using the Hamada Equation: BL = Bu 1+(1-T where: where Bu is the levered beta, Bu is the unlevered beta, T is the tax rate, D is the debt and E is the equity of the firm. The following steps may be used to calculate the effects of changing the capital structure on the cost of equity: 1) Estimate the current beta for the firm with its current capital structure. This represents the beta of the firm based on its current capital structure. 2) Estimate the unlevered beta for the firm. This represents the beta for the firm if it had no debt, i.e. no leverage. 3) Use the unlevered beta to calculate the levered beta for the firm at the new debt level. For example, consider a firm with a current beta of 1.25, D=45%, E = 55%, and T = 37%. The unlevered beta can then be calculated as: 1.25 Bu = = 0.824835 0.45 1+(1-1) 1+(10.37) 0.55 This Bu can then be used to calculate the levered beta (BL) for the firm (say for D= 55%, E = 45%, T = 37%) as: BL - + (1-1) = 0.824835 824825 [1+(1-0.37) - = 1.46 In this case, the comparable firm ELP is used to estimate the beta for PSUWC. However, the beta that is listed is for the Capital Structure of ELP Therefore, we need to unlever the listed beta and calculate the "pure" beta for the firm and therefore our firm) and then re-lever it based on OUR firm's Capital Structure. 0.810% Economic life of project in years. Price of New Equipment Change in NWC $ 33,000,000.00 0.920 $ Besuwc (Re-levered) 6,000,000.00 4,200,000.00 Fixed Costs $ 47% Variable Costs (% of Revenue) Salvage value of New Equipment Marginal Tax Rate $ 7,000,000.00 30.0% 34000 kw per hour 59% Parameters Rm Original Debt Rf Original Equity BELP (From Yahoo!) New Debt BELP (Unlevered) New Equity Re Old D/E Ratio Rd New D/E Ratio New Wd % Raised via Bonds 24.0% New We % Raised via Equity 76.0% WACC Old Wd ELP Total Liabilities Old We ELP Total Stockholder Equity ELP D/E Ratio Note Cells C20 and C21 include the initial (today's) cash flows. Column D through I are the operating cash flows. Cells 138-141 contain the terminal cash flows. Generation First Year Capacity factor Capacity Factor Growth Rate Sale Price $ 16% 0.148 per kw-hour 991.00 Cost of Bonds $ Cost of Stock $ 15.00 Tom Jones, the CFO for the firm PSUWC Energy, LLC, woke up with a start at 4:00 am on 6/18/2021, due to his phone ringing. It was his senior financial analyst, vacationing in Europe, calling with bad news. Tom was supposed to present his project evaluation at the end of the week for the Board's proposal that they invest in new equipment that generates electricity, using a new nuclear technology. His staff of financial analysts had been working hard over the last few weeks collecting data and had prepared a model creating a financial forecast about the proposed project's viability. Disaster had struck on the night of 6/17/2021 wherein malware all but wiped out the work of the analysts. Tom needed to prepare a financial analysis of the project to present the Board with his recommendations. All the staff had already left for their annual vacation and Tom was on his own. Tom quickly reached his office and managed to salvage what was left of the excel spreadsheet prepared for the presentation. retrieve about the project. What follows is some basic information that Tom knew and was able PSUWC's existing plant has excess capacity, in a fully depreciated building, to install and run the new equipment. Due to relatively rapid advances in the technology, the project was expected to be discontinued in six years. The proposed project was capable of providing 34000 kW [1] per hour power. Typically, PSUWC ran its plants 24 hours a day, 7 days a week at an average of 59 % Capacity factor [2], which is what the project would start with. However, his engineers had assured him that the implementation of the new technology would enable them to increase their capacity factor by 16 % a year till they reached a 100% capacity factor. (This meant that the capacity factor for year 2, CF2, would be = CF1*(1+growth_rate), till 100% was reached and then would stay at 100%). A total investment of $ 33,000,000.00 USD for new equipment was required. The equipment had fixed maintenance contracts of 4,200,000.00 per year with a salvage value of $ 7,000,000.00 and variable costs were 47 % of revenues. The new equipment would be depreciated to zero using straight line depreciation. The new project required an increase in working capital of $ 6,000,000.00 and $ 1.200,000.00 of this increase would be offset with accounts payable. PSUWC would be able to sell all the electricity it generated at the rate of 0.148 per kilo-watt hour the market they served. The corporate tax rate was 30 % and PSUWC currently has 1,000,000 shares of stock outstanding at a current price of $ 15.00. The company also has 30,000 bonds outstanding, with a current price of $ 991.00. The bonds pay interest semi-annually at a coupon rate of 5.10 %. The bonds have a par value of $1,000 and will mature in 19 years. available financial information. However, management believes that given the industry they are in the most reasonable comparable publicly traded company is Companhia Paranaense de Energia - COPEL (NYSE Ticker Symbol ELP) [3] . In addition management believes the S&P 500 is a reasonable proxy for the market portfolio. Therefore, the cost of equity is calculated using the beta from ELP and the market risk premium based on the S&P 500 annual expected rate of return [4] Tom knew that because of the size of the proposed project, he had to take into account the change in capital structure the new project would cause his firm. To this end, he had a choice between raising the new capital needed either using 24 %/76% split between issuing bonds/equity or a 76 % /24 % split between issuing bonds/equity. The bonds would have to be retired at the end of the project's life [6]. Tom knew that the cost of debt would depend on the new D/E ratio that the firm would have based on his decision to raise capital. Tom looked at the worksheet titled Rd with Dto, realizing that the cost of debt increased with an increasing D/E ratio [7]. Additionally, the state government had promised to raise the debt for PSUWC via the issuance of bonds, with the caveat that upon termination of the project PSUWC would have to pay a Nuclear Waste Disposal Fee, equivalent to the amount money raised via the issuance of debt. Tom needed to calculate the rate at which he would have to discount the project to calculate the Net present Value of the proposed project based on his decision of raising capital and the current capital market environment. This discount rate, the WACC, would obviously influence the NPV and could affect the decision of whether or not to accept the project. Thankfully, he had all the information needed to calculate this and hence the NPV. Tom needed to clearly show all his calculations and sources for all parameter estimates used in the calculation of the WACC. Gathering all the available information, Tom got a large cup of extra strong coffee and sat down to work on the development of his Capital Budgeting project model. His correct recommendation to the board was critical to the future growth of the firm! Cost of Debt as a function of Debt-to-Equity Ratio %Debt%Equity D/E Interest rate 0% 100% 0.00 5.00% 10.0% 90% 0.11 5.00% 20.0% 80% 0.25 5.00% 30.0% 70% 0.43 5.20% 40.0% 60% 0.67 5.20% 50.0% 50% 1.00 5.30% 60.0% 40% 1.50 7.50% 70.0% 30% 2.33 7.800% 80.0% 20% 4.00 7.900% 90.0% 10% 9.00 8.000% 100.0% 0% 9.01E+15 10.000% 1343721 1424918 1595809 1357716 Other Long Term Assets. Total Total non-current assets Total Assets 1229882 30403354 29252254 27460543 26031219 22014260 38312550 35930100 33162377 30434209 28947657 1419822 3297928 2416728 2601940 1613126 1685280 1419243 1683577 1255639 311916 LIABILITIES Accounts Payable Taxes payable Accrued liabilities Deferred revenues Other Current Liabilities 60132 197949 86310 41454 182524 337044 194167 192891 176679 277458 28508 79872 150025 141712 167881 Total Current Liabilities 375395 270429 475585 386774 4789118 10152271 7413755 6235162 6528425 8267510 157420 293666 156630 178430 214 - Long Term Debt Deferred taxes liabilities Deferred revenues Other long-term liabilities Total non-current liabilities Total Liabilities 85060 418837 340409 376107 231112 15368717 12898772 11541960 9622727 9574061 20714338 19593886 17651874 15278763 14363179 10800000 7910000 7910000 7910000 - 4846239 6422564 5557843 5162983 5413572 STOCKHOLDER EQUITY Common Stock Retained Earnings Accumulated other comprehensive income Total stockholders' equity Total liabilities and stockholders' equity 1014248 914751 844398 792716 744784 17252414 16032925 15207842 14864165 14245728 38312550 35930100 33162377 30434209 28947657 Estimation of Beta with Changes in Capital Structure We can estimate the change in the cost of equity as a function of the capital structure by using the Hamada Equation: BL = Bu 1+(1-T where: where Bu is the levered beta, Bu is the unlevered beta, T is the tax rate, D is the debt and E is the equity of the firm. The following steps may be used to calculate the effects of changing the capital structure on the cost of equity: 1) Estimate the current beta for the firm with its current capital structure. This represents the beta of the firm based on its current capital structure. 2) Estimate the unlevered beta for the firm. This represents the beta for the firm if it had no debt, i.e. no leverage. 3) Use the unlevered beta to calculate the levered beta for the firm at the new debt level. For example, consider a firm with a current beta of 1.25, D=45%, E = 55%, and T = 37%. The unlevered beta can then be calculated as: 1.25 Bu = = 0.824835 0.45 1+(1-1) 1+(10.37) 0.55 This Bu can then be used to calculate the levered beta (BL) for the firm (say for D= 55%, E = 45%, T = 37%) as: BL - + (1-1) = 0.824835 824825 [1+(1-0.37) - = 1.46 In this case, the comparable firm ELP is used to estimate the beta for PSUWC. However, the beta that is listed is for the Capital Structure of ELP Therefore, we need to unlever the listed beta and calculate the "pure" beta for the firm and therefore our firm) and then re-lever it based on OUR firm's Capital Structure


