Answered step by step
Verified Expert Solution
Question
1 Approved Answer
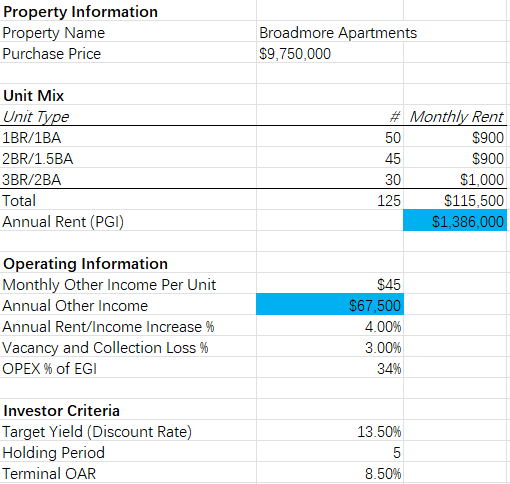
Please fill the blue box (please show the formula). Property Information Property Name Purchase Price Broadmore Apartments $9,750,000 Unit Mix Unit Type 1BR/1BA 2BR/1.5BA 3BR/2BA


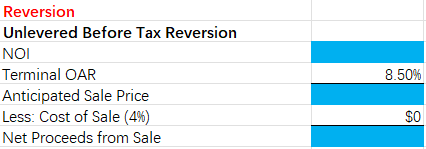
Please fill the blue box (please show the formula).
Property Information Property Name Purchase Price Broadmore Apartments $9,750,000 Unit Mix Unit Type 1BR/1BA 2BR/1.5BA 3BR/2BA Total Annual Rent (PGI) # Monthly Rent 50 $900 45 $900 30 $1,000 125 $115,500 $1,386,000 Operating Information Monthly Other Income Per Unit Annual Other Income Annual Rent/Income Increase % Vacancy and Collection Loss % OPEX % of EGI $45 $67,500 4.00% 3.00% 34% Investor Criteria Target Yield (Discount Rate) Holding Period Terminal OAR 13.50% 5 8.50% Cash Flow Analysis Unlevered Before Tax Cash Flow Year 0 6 Potential Gross Income (PGI) Less: Vacancy and Collection Loss Other Income Effective Gross Income (EGI) Operating Expenses (OPEX) Net Operating income (NOI) Purchase Price Net Proceeds from Sale Total 1 $1,386,000 -$41,580 $67,500 $1,411,920 -$480,053 $2,343,787 2 $1,441,440 -$43,243 $70,200 $1,468,397 -$499,255 $2,437,539 3 $1.499,098 -$44.973 $73,008 $1,527,133 -$519, 225 $2,535,040 4 $1,559,062 -$46,772 $75,928 $1,588,218 -$539,994 $2,636,442 5 $1,621,424 -$48,643 $78,965 $1,651,747 -S561,594 $2,741,900 $1,686,281 -$50,588 $82,124 $1,717,817 -$584,058 $2,851,575 Property Metrics Unlevered NPV Unlevered IRR OAR at Acquisition Reversion Unlevered Before Tax Reversion NOI Terminal OAR Anticipated Sale Price Less: Cost of Sale (4%) Net Proceeds from Sale 8.50% SO Property Information Property Name Purchase Price Broadmore Apartments $9,750,000 Unit Mix Unit Type 1BR/1BA 2BR/1.5BA 3BR/2BA Total Annual Rent (PGI) # Monthly Rent 50 $900 45 $900 30 $1,000 125 $115,500 $1,386,000 Operating Information Monthly Other Income Per Unit Annual Other Income Annual Rent/Income Increase % Vacancy and Collection Loss % OPEX % of EGI $45 $67,500 4.00% 3.00% 34% Investor Criteria Target Yield (Discount Rate) Holding Period Terminal OAR 13.50% 5 8.50% Cash Flow Analysis Unlevered Before Tax Cash Flow Year 0 6 Potential Gross Income (PGI) Less: Vacancy and Collection Loss Other Income Effective Gross Income (EGI) Operating Expenses (OPEX) Net Operating income (NOI) Purchase Price Net Proceeds from Sale Total 1 $1,386,000 -$41,580 $67,500 $1,411,920 -$480,053 $2,343,787 2 $1,441,440 -$43,243 $70,200 $1,468,397 -$499,255 $2,437,539 3 $1.499,098 -$44.973 $73,008 $1,527,133 -$519, 225 $2,535,040 4 $1,559,062 -$46,772 $75,928 $1,588,218 -$539,994 $2,636,442 5 $1,621,424 -$48,643 $78,965 $1,651,747 -S561,594 $2,741,900 $1,686,281 -$50,588 $82,124 $1,717,817 -$584,058 $2,851,575 Property Metrics Unlevered NPV Unlevered IRR OAR at Acquisition Reversion Unlevered Before Tax Reversion NOI Terminal OAR Anticipated Sale Price Less: Cost of Sale (4%) Net Proceeds from Sale 8.50% SOStep by Step Solution
There are 3 Steps involved in it
Step: 1

Get Instant Access to Expert-Tailored Solutions
See step-by-step solutions with expert insights and AI powered tools for academic success
Step: 2

Step: 3

Ace Your Homework with AI
Get the answers you need in no time with our AI-driven, step-by-step assistance
Get Started


