Answered step by step
Verified Expert Solution
Question
1 Approved Answer
Please find Altman's Z score for this with formulas and calculations. please CONSOLIDATED BALANCE SHEET AS AT 31 MARCH 2021 Notes 31 March 2021 in
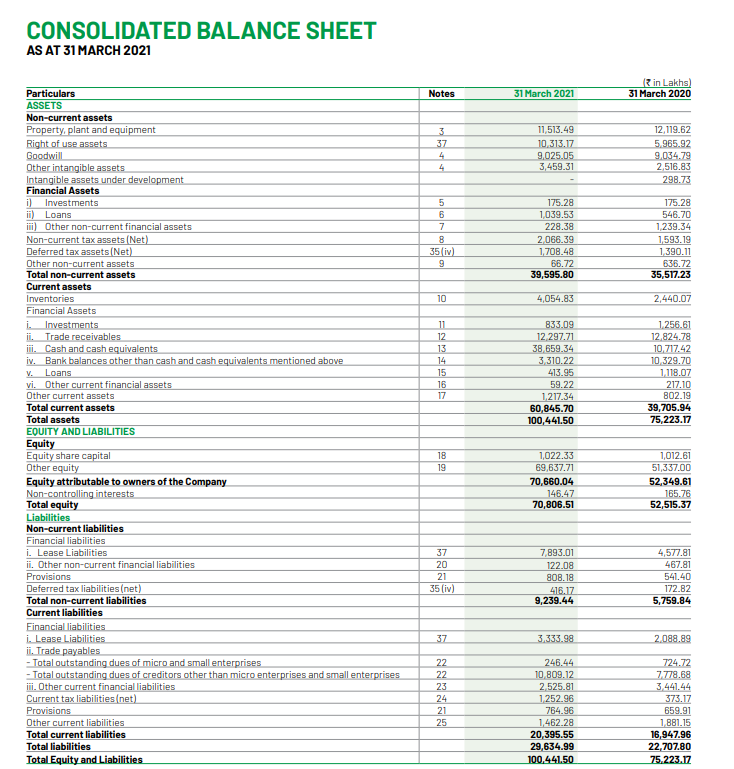
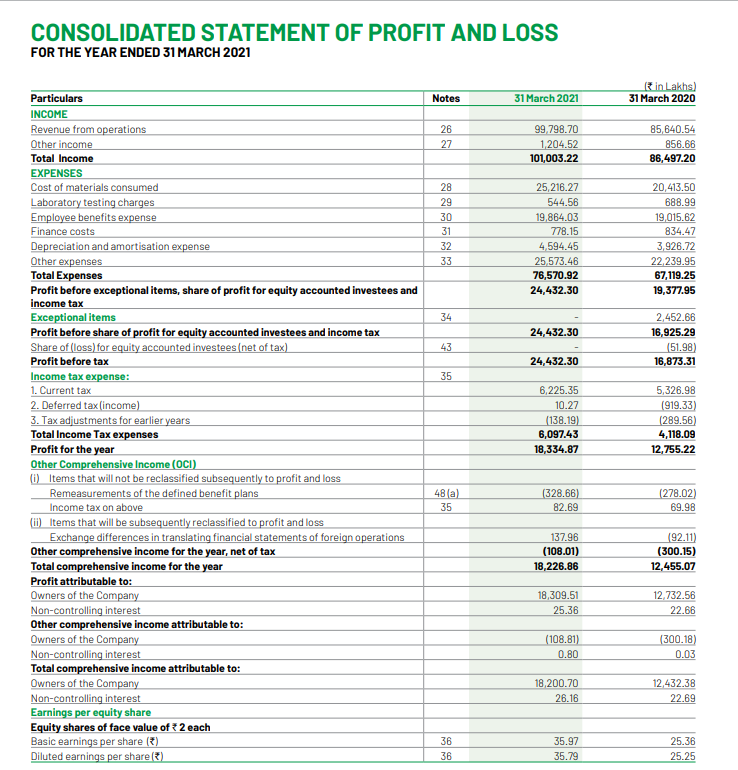
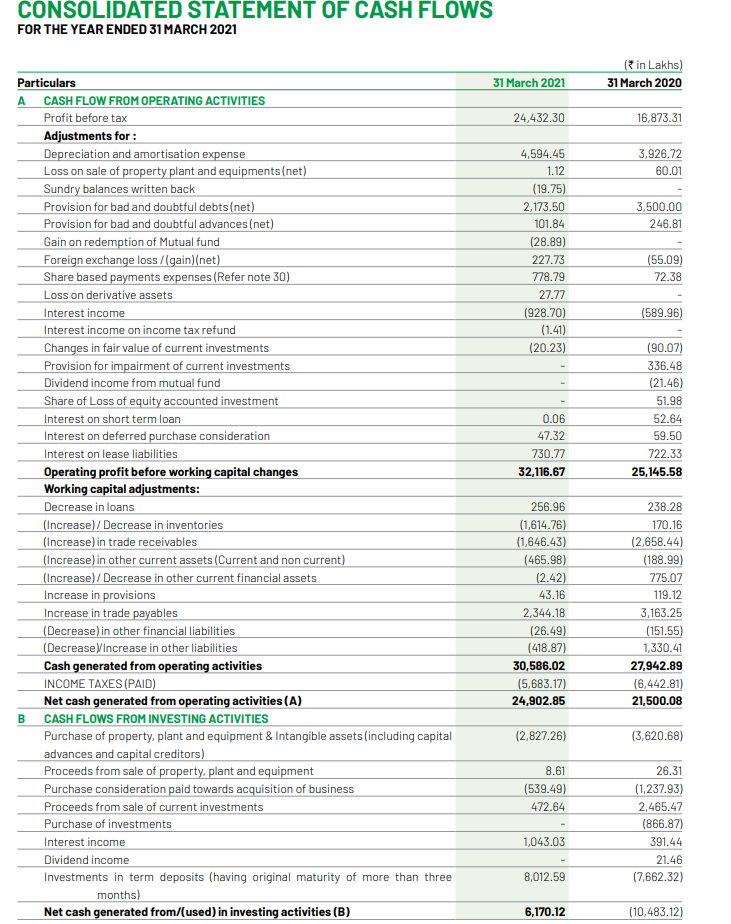
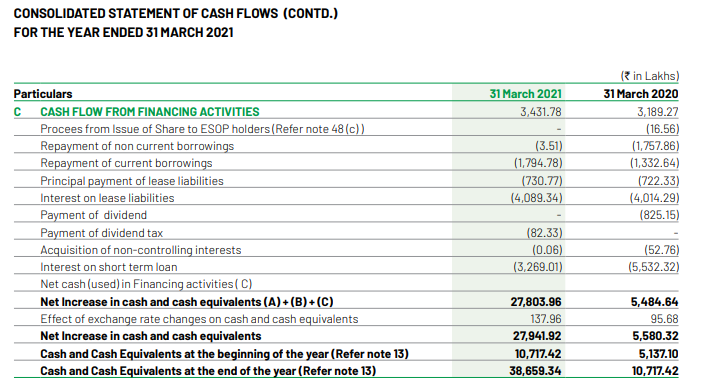
Please find Altman's Z score for this with formulas and calculations. please
CONSOLIDATED BALANCE SHEET AS AT 31 MARCH 2021 Notes 31 March 2021 in Lakhs) 31 March 2020 3 37 4 4 11,513.49 10 313.17 9,025.05 3,459.31 12.119.62 5.965.92 9.034.79 2.516.83 298.73 LOG 5 6 7 8 35 iv) 9 175.28 1,039.53 228.38 2,066.39 1,708.48 66.72 39,595.80 175.28 546.70 1239.34 1,593.19 1,390.11 636.72 35,517.23 10 4,054.83 2,440.07 11 12 13 14 15 16 17 833.09 12.297.71 38 659.34 3310.22 413.95 59.22 1.217.34 60,845.70 100,441.50 1.256.61 12,824.78 10.717.42 10 329.70 1.118.07 217.10 802.19 39,705.94 75,223.17 Particulars ASSETS Non-current assets Property, plant and equipment Right of use assets Goodwill Other intangible assets Intangible assets under development Financial Assets i) Investments ii) Loans iii) Other non-current financial assets Non-current tax assets (Net) Deferred tax assets (Net) Other non-current assets Total non-current assets Current assets Inventories Financial Assets i Investments ii. Trade receivables iii. Cash and cash equivalents iv. Bank balances other than cash and cash equivalents mentioned above V. Loans vi. Other current financial assets Other current assets Total current assets Total assets EQUITY AND LIABILITIES Equity Equity share capital Other equity Equity attributable to owners of the Company Non-controlling interests Total equity Liabilities Non-current liabilities Financial liabilities i. Lease Liabilities ii. Other non-current financial liabilities Provisions Deferred tax liabilities (net) Total non-current liabilities Current liabilities Financial liabilities i. Lease Liabilities ii. Trade payables - Total outstanding dues of micro and small enterprises - Total outstanding dues of creditors other than micro enterprises and small enterprises iii. Other current financial liabilities Current tax liabilities (net) Provisions Other current liabilities Total current liabilities Total liabilities Total Equity and Liabilities 18 19 1,022.33 69,637.71 70,660.04 146.47 70,806.51 1,012.61 51,337.00 52,349.61 165.76 52,515.37 37 20 21 35 (iv) 7,893.01 122.08 808.18 416.17 9,239.44 4,577.81 467.81 541.40 172.82 5,759.84 37 3.333.98 2.098.99 22 22 23 24 21 25 246.44 10 809.12 2 525.81 1,252.96 764.96 1,462.28 20,395.55 29,634.99 100,441.50 724.72 7.778.68 3.441.44 373.17 659.91 1,881.15 16,947.96 22.707.80 75,223.17 CONSOLIDATED STATEMENT OF PROFIT AND LOSS FOR THE YEAR ENDED 31 MARCH 2021 in Lakhs) 31 March 2020 Notes 31 March 2021 26 27 99798.70 1,204.52 101,003.22 85,640.54 856.66 86,497.20 28 29 30 31 32 33 25,216.27 544.56 19,864.03 778.15 4,594.45 25573.46 76,570.92 24,432.30 20,413.50 688.99 19,015.62 834.47 3,926.72 22,239.95 67, 119.25 19,377.95 34 24,432.30 2,452.66 16,925.29 (51.98) 16,873.31 43 24,432.30 35 Particulars INCOME Revenue from operations Other income Total Income EXPENSES Cost of materials consumed Laboratory testing charges Employee benefits expense Finance costs Depreciation and amortisation expense Other expenses Total Expenses Profit before exceptional items, share of profit for equity accounted investees and income tax Exceptional items Profit before share of profit for equity accounted investees and income tax Share of loss for equity accounted investees (net of tax) Profit before tax Income tax expense: 1. Current tax 2. Deferred tax (income) 3. Tax adjustments for earlier years Total Income Tax expenses Profit for the year Other Comprehensive Income (OCI) (0) Items that will not be reclassified subsequently to profit and loss Remeasurements of the defined benefit plans Income tax on above (ii) Items that will be subsequently reclassified to profit and loss Exchange differences in translating financial statements of foreign operations Other comprehensive income for the year, net of tax Total comprehensive income for the year Profit attributable to: Owners of the Company Non-controlling interest Other comprehensive income attributable to: Owners of the Company Non-controlling interest Total comprehensive income attributable to: Owners of the Company Non-controlling interest Earnings per equity share Equity shares of face value of 2 each Basic earnings per share (5) Diluted earnings per share (3) 6,225.35 10.27 (138.19) 6,097.43 18,334.87 5,326.98 (919.33) (289.56) 4,118.09 12,755.22 48 al 35 (328.66) 82.69 (278.02) 69.98 137.96 (108.01) 18,226.86 (92.11) (300.15) 12,455.07 18,309.51 25.36 12.732.56 22.66 (108.81) 0.80 (300.18) 0.03 18,200.70 26.16 12,432.38 22.69 36 36 35.97 35.79 25.36 25.25 CONSOLIDATED STATEMENT OF CASH FLOWS FOR THE YEAR ENDED 31 MARCH 2021 31 March 2021 (in Lakhs) 31 March 2020 24,432.30 16,873.31 3,926.72 60.01 4,594.45 1.12 (19.75) 2,173.50 3,500.00 246.81 (55.09) 72.38 101.84 (28.89) 227.73 778.79 27.77 (928.70) (1.41) (20.23) (589.96) (90.07) 336.48 (21.46) 51.98 52.64 59.50 722.33 25,145.58 0.06 47.32 730.77 32,116.67 Particulars A CASH FLOW FROM OPERATING ACTIVITIES Profit before tax Adjustments for: Depreciation and amortisation expense Loss on sale of property plant and equipments (net) Sundry balances written back Provision for bad and doubtful debts(net) Provision for bad and doubtful advances (net) Gain on redemption of Mutual fund Foreign exchange loss/(gain)(net) Share based payments expenses (Refer note 30) Loss on derivative assets Interest income Interest income on income tax refund Changes in fair value of current investments Provision for impairment of current investments Dividend income from mutual fund Share of Loss of equity accounted investment Interest on short term loan Interest on deferred purchase consideration Interest on lease liabilities Operating profit before working capital changes Working capital adjustments: Decrease in loans (Increase)/Decrease in inventories (Increase) in trade receivables (Increase) in other current assets (Current and non current) (Increase)/Decrease in other current financial assets Increase in provisions Increase in trade payables (Decrease) in other financial liabilities (Decrease/Increase in other liabilities Cash generated from operating activities INCOME TAXES (PAID) Net cash generated from operating activities (A) B CASH FLOWS FROM INVESTING ACTIVITIES Purchase of property, plant and equipment & Intangible assets (including capital advances and capital creditors) Proceeds from sale of property, plant and equipment Purchase consideration paid towards acquisition of business Proceeds from sale of current investments Purchase of investments Interest income Dividend income Investments in term deposits (having original maturity of more than three months) Net cash generated from/(used) in investing activities (B) 256.96 (1,614.76) (1,646.43) (465.98) (2.42) 43.16 2,344.18 (26.49) (418.87) 30,586.02 (5,683.17) 24,902.85 238.28 170.16 (2,658.44) (188.99) 775.07 119.12 3,163.25 (151.55) 1,330.41 27,942.89 (6,442.81) 21,500.08 (2,827.26) (3,620.68) 8.61 (539.49) 472.64 26.31 (1.237.93) 2,465.47 (866.87) 391.44 21.46 (7,662.32) 1,043.03 8,012.59 6,170.12 (10,483.12) CONSOLIDATED STATEMENT OF CASH FLOWS (CONTD.) FOR THE YEAR ENDED 31 MARCH 2021 31 March 2021 3,431.78 (3.51) (1,794.78) (730.77) (4,089.34) (in Lakhs) 31 March 2020 3,189.27 (16.56) (1,757.86) (1,332.64) (722.33) (4,014.29) (825.15) Particulars C CASH FLOW FROM FINANCING ACTIVITIES Procees from Issue of Share to ESOP holders(Refer note 48 (c)) Repayment of non current borrowings Repayment of current borrowings Principal payment of lease liabilities Interest on lease liabilities Payment of dividend Payment of dividend tax Acquisition of non-controlling interests Interest on short term loan Net cash (used) in Financing activities(C) Net Increase in cash and cash equivalents (A)+(B)+(C) Effect of exchange rate changes on cash and cash equivalents Net Increase in cash and cash equivalents Cash and Cash Equivalents at the beginning of the year (Refer note 13) Cash and Cash Equivalents at the end of the year (Refer note 13) (82.33) (0.06) (3,269.01) (52.76) (5,532.32) 27,803.96 137.96 27,941.92 10,717.42 38,659.34 5,484.64 95.68 5,580.32 5,137.10 10,717.42Step by Step Solution
There are 3 Steps involved in it
Step: 1

Get Instant Access to Expert-Tailored Solutions
See step-by-step solutions with expert insights and AI powered tools for academic success
Step: 2

Step: 3

Ace Your Homework with AI
Get the answers you need in no time with our AI-driven, step-by-step assistance
Get Started


