Please find the ratio analysis
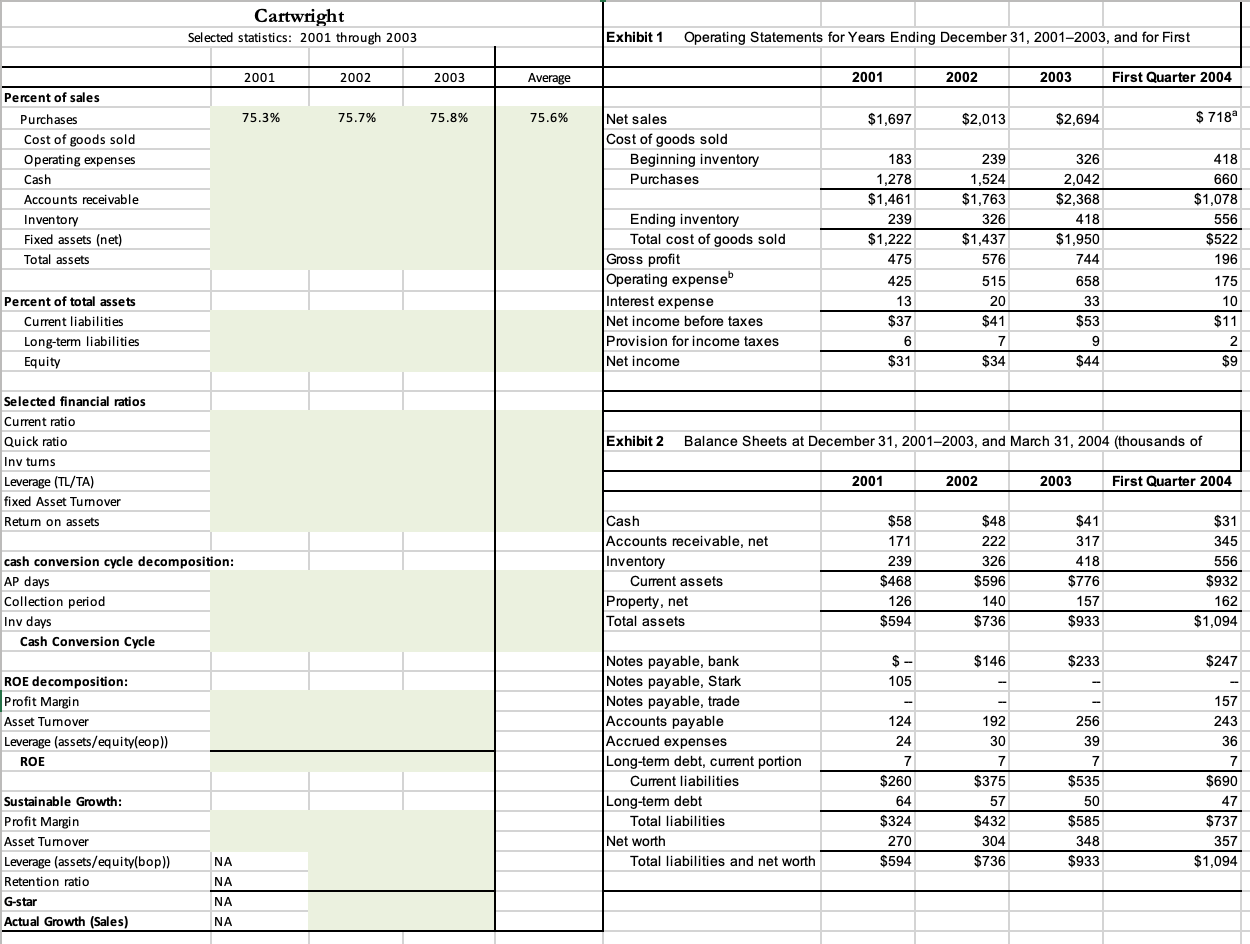
Cartwright Selected statistics: 2001 through 2003 Exhibit 1 Operating Statements for Years Ending December 31, 2001-2003, and for First 2001 2002 2003 Average 2001 2002 2003 First Quarter 2004 75.3% 75.7% 75.8% 75.6% $1,697 $2,013 $2,694 $ 7189 Percent of sales Purchases Cost of goods sold Operating expenses Cash Accounts receivable Inventory Fixed assets (net) Total assets Net sales Cost of goods sold Beginning inventory Purchases Ending inventory Total cost of goods sold Gross profit Operating expense Interest expense Net income before taxes Provision for income taxes Net income 183 1,278 $1,461 239 $1,222 475 425 13 $37 6 $31 239 1,524 $1,763 326 $1,437 576 515 20 $41 7 7 $34 326 2,042 $2,368 418 $1,950 744 658 33 $53 9 $44 418 660 $1,078 556 $522 196 175 10 $11 2 $9 Percent of total assets Current liabilities Long-term liabilities Equity Exhibit 2 Balance Sheets at December 31, 2001-2003, and March 31, 2004 (thousands of Selected financial ratios Current ratio Quick ratio Inv turns Leverage (TL/TA) fixed Asset Turnover Return on assets 2001 2002 2003 First Quarter 2004 cash conversion cycle decomposition: Cash Accounts receivable, net Inventory Current assets Property, net Total assets $58 171 239 $468 126 $594 $48 222 326 $596 140 $736 $41 317 418 $776 157 $933 $31 345 556 $932 162 $1,094 AP days Collection period Inv days Cash Conversion Cycle $146 $233 $- 105 $247 ROE decomposition: Profit Margin Asset Turnover Leverage (assets/equity(eop)) ROE Notes payable, bank Notes payable, Stark Notes payable, trade Accounts payable Accrued expenses Long-term debt, current portion Current liabilities Long-term debt Total liabilities Net worth Total liabilities and net worth 124 24 7 $260 64 $324 270 $594 192 30 7 $375 57 $432 304 $736 256 39 7 $535 50 $585 348 $933 157 243 36 7 $690 47 $737 357 $1,094 Sustainable Growth: Profit Margin Asset Turnover Leverage (assets/equity(bop) Retention ratio G-star Actual Growth (Sales) NA NA NA NA Cartwright Selected statistics: 2001 through 2003 Exhibit 1 Operating Statements for Years Ending December 31, 2001-2003, and for First 2001 2002 2003 Average 2001 2002 2003 First Quarter 2004 75.3% 75.7% 75.8% 75.6% $1,697 $2,013 $2,694 $ 7189 Percent of sales Purchases Cost of goods sold Operating expenses Cash Accounts receivable Inventory Fixed assets (net) Total assets Net sales Cost of goods sold Beginning inventory Purchases Ending inventory Total cost of goods sold Gross profit Operating expense Interest expense Net income before taxes Provision for income taxes Net income 183 1,278 $1,461 239 $1,222 475 425 13 $37 6 $31 239 1,524 $1,763 326 $1,437 576 515 20 $41 7 7 $34 326 2,042 $2,368 418 $1,950 744 658 33 $53 9 $44 418 660 $1,078 556 $522 196 175 10 $11 2 $9 Percent of total assets Current liabilities Long-term liabilities Equity Exhibit 2 Balance Sheets at December 31, 2001-2003, and March 31, 2004 (thousands of Selected financial ratios Current ratio Quick ratio Inv turns Leverage (TL/TA) fixed Asset Turnover Return on assets 2001 2002 2003 First Quarter 2004 cash conversion cycle decomposition: Cash Accounts receivable, net Inventory Current assets Property, net Total assets $58 171 239 $468 126 $594 $48 222 326 $596 140 $736 $41 317 418 $776 157 $933 $31 345 556 $932 162 $1,094 AP days Collection period Inv days Cash Conversion Cycle $146 $233 $- 105 $247 ROE decomposition: Profit Margin Asset Turnover Leverage (assets/equity(eop)) ROE Notes payable, bank Notes payable, Stark Notes payable, trade Accounts payable Accrued expenses Long-term debt, current portion Current liabilities Long-term debt Total liabilities Net worth Total liabilities and net worth 124 24 7 $260 64 $324 270 $594 192 30 7 $375 57 $432 304 $736 256 39 7 $535 50 $585 348 $933 157 243 36 7 $690 47 $737 357 $1,094 Sustainable Growth: Profit Margin Asset Turnover Leverage (assets/equity(bop) Retention ratio G-star Actual Growth (Sales) NA NA NA NA