

Question
please fix the code df2=df.drop(columns=['Gender']) display(df2.head()) from sklearn.model_selection import train_test_split X = df2.iloc[:,:-1].values y = df2.iloc[:, -1].values X_train, X_test, y_train, y_test,ind_train,ind_test = train_test_split(X, y,df2.index, test_size=0.1,
please fix the code 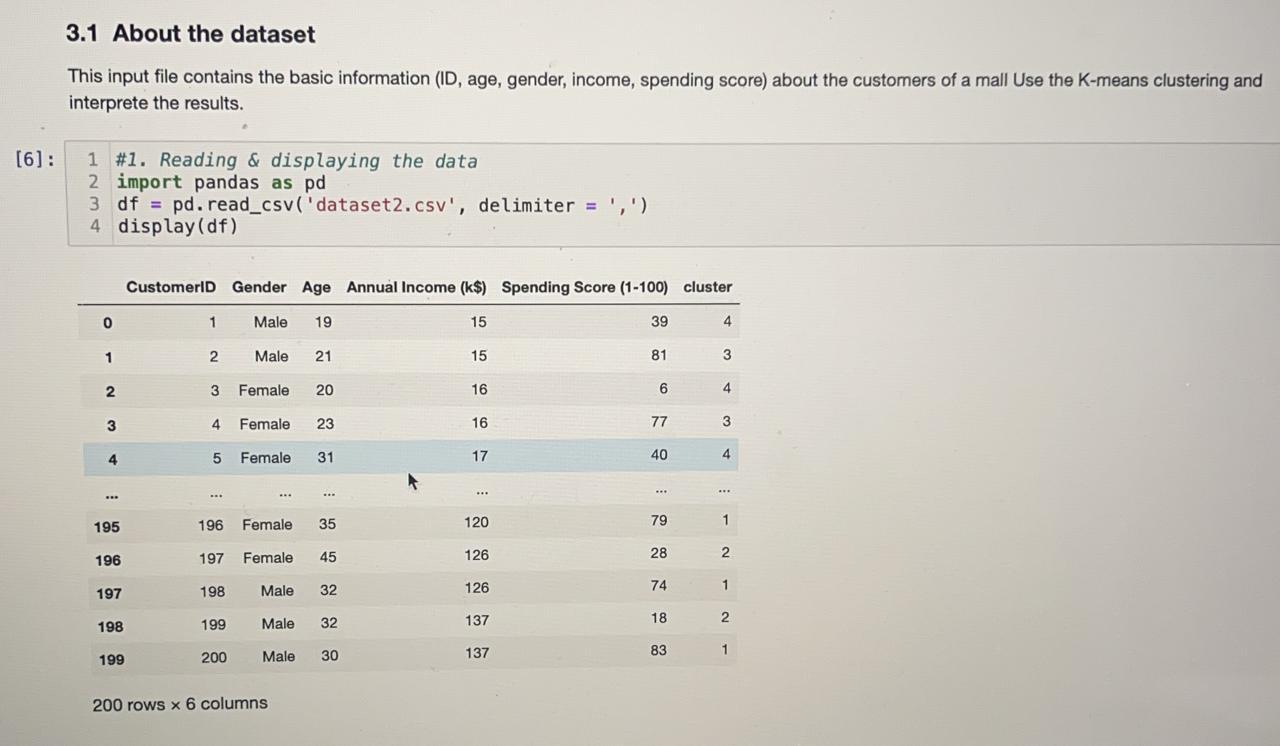
df2=df.drop(columns=['Gender']) display(df2.head())
from sklearn.model_selection import train_test_split X = df2.iloc[:,:-1].values y = df2.iloc[:, -1].values X_train, X_test, y_train, y_test,ind_train,ind_test = train_test_split(X, y,df2.index, test_size=0.1, random_state=12)
X_train_org=X_train
from sklearn.preprocessing import StandardScaler scaler = StandardScaler() scaler.fit(X_train)
X_train = scaler.transform(X_train) X_test = scaler.transform(X_test)
from sklearn import metrics
k_vals=range(2,20)
sShil_max = np.empty([len(k_vals),1]) sDaBo_min = np.empty_like(sShil_max) rndAdj_max = np.empty_like(sShil_max) nmi_max = np.empty_like(sShil_max)
for i,n in enumerate(k_vals): hclus = AgglomerativeClustering(n_clusters=n,linkage="complete").fit(X_train) sShil_max[i] = metrics.silhouette_score(X_train,hclus.labels_) sDaBo_min[i] = metrics.davies_bouldin_score(X_train,hclus.labels_) rndAdj_max[i]= metrics.cluster.adjusted_rand_score(y_train, hclus.labels_) nmi_max[i]=metrics.cluster.normalized_mutual_info_score(y_train, hclus.labels_)
plt.plot(k_vals, sShil_max, 'o:',c='r') plt.plot(k_vals, sDaBo_min, 's:',c='b') plt.plot(k_vals, rndAdj_max, '^:',c='g') plt.plot(k_vals, nmi_max, 'd:',c='m') plt.xlabel("K") plt.ylabel("Cluster Indices") plt.legend(['SI','DBI','ARI','NMI']) plt.show()
3.1 About the dataset This input file contains the basic information (ID, age, gender, income, spending score) about the customers of a mall Use the K-means clustering and interprete the results. 1 \#1. Reading \& displaying the data 2 import pandas as pd 3 df = pd.read_csv('dataset2.csv', delimiter =,) 4 display(df) 200 rows 6 columnsStep by Step Solution
There are 3 Steps involved in it
Step: 1

Get Instant Access to Expert-Tailored Solutions
See step-by-step solutions with expert insights and AI powered tools for academic success
Step: 2

Step: 3
Ace Your Homework with AI
Get the answers you need in no time with our AI-driven, step-by-step assistance
Get Started
MongoDB 4 Quick Start Guide Learn The Skills You Need To Work With The World S Most Popular NoSQL Database
Authors: Doug Bierer
1st Edition
1789343534, 978-1789343533