please forgive the pictures, it was the only way I could post the assignment here, thank you tutors
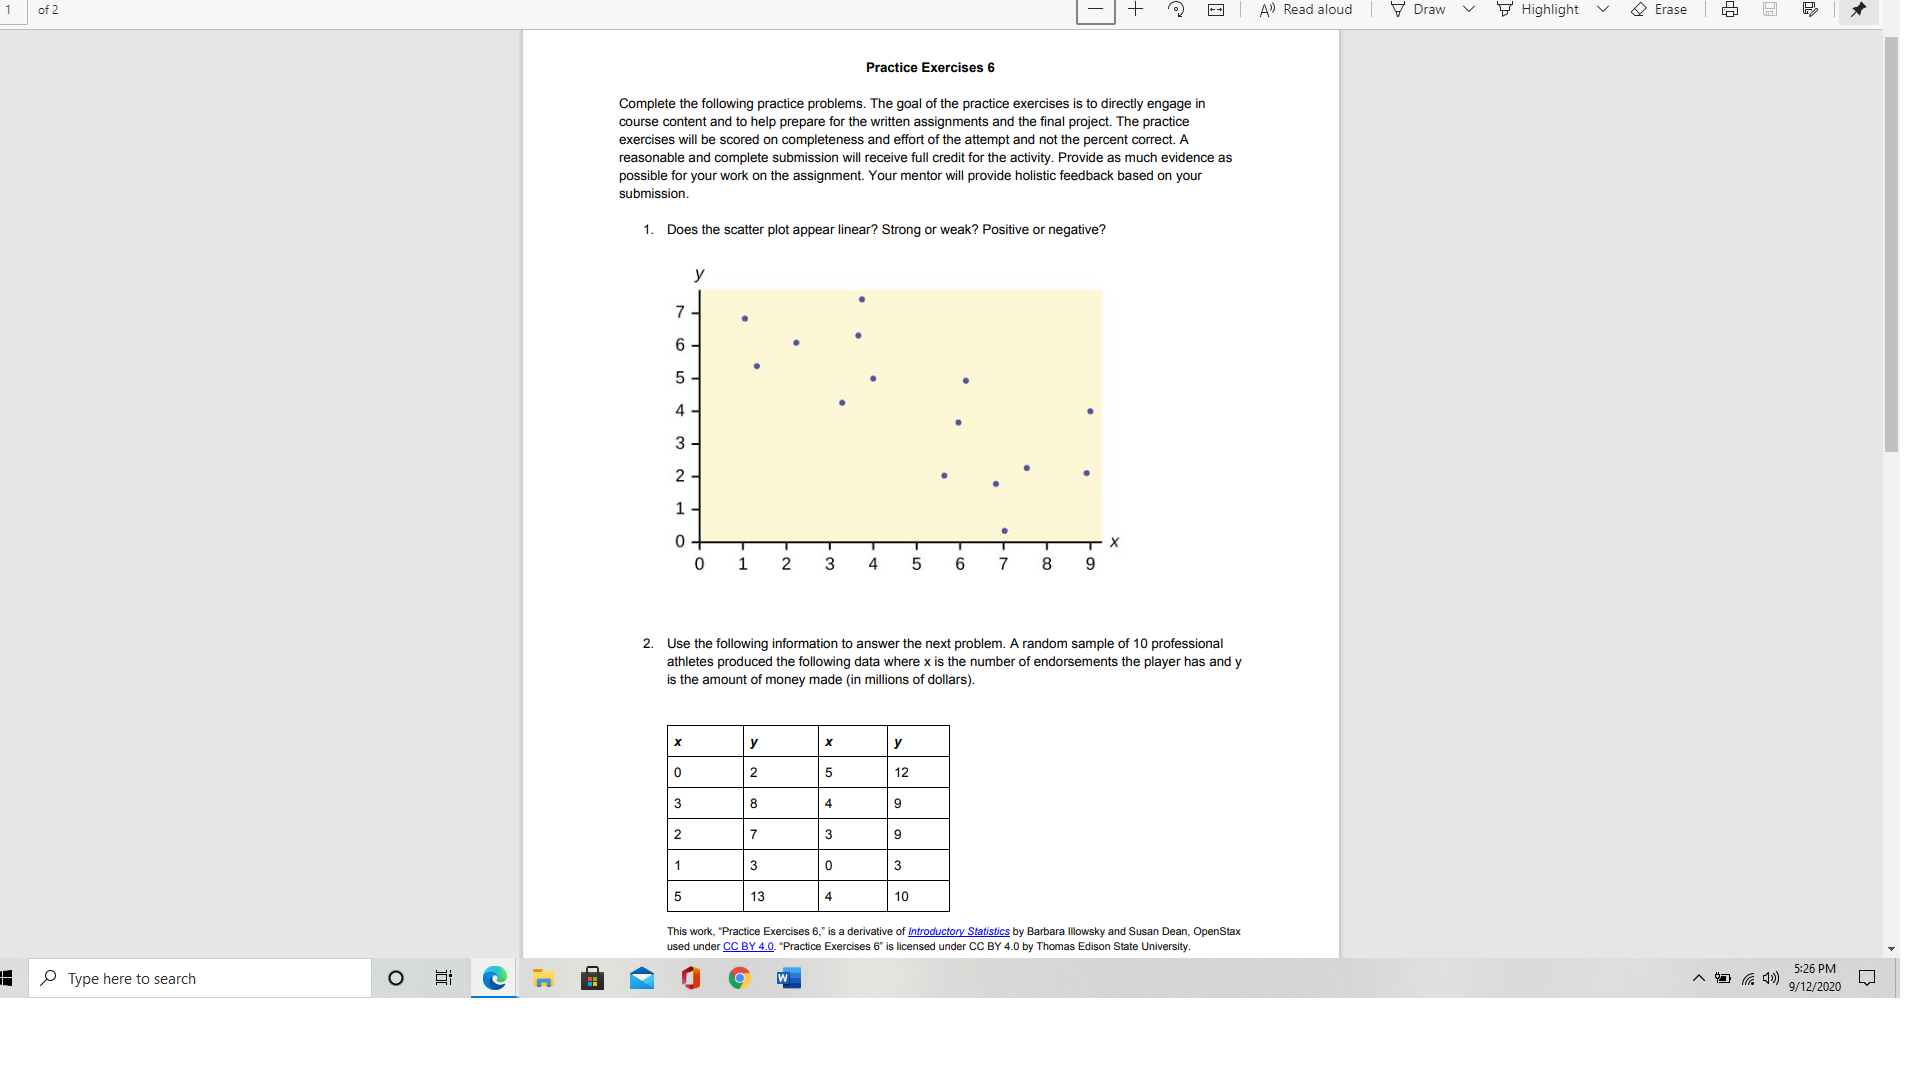
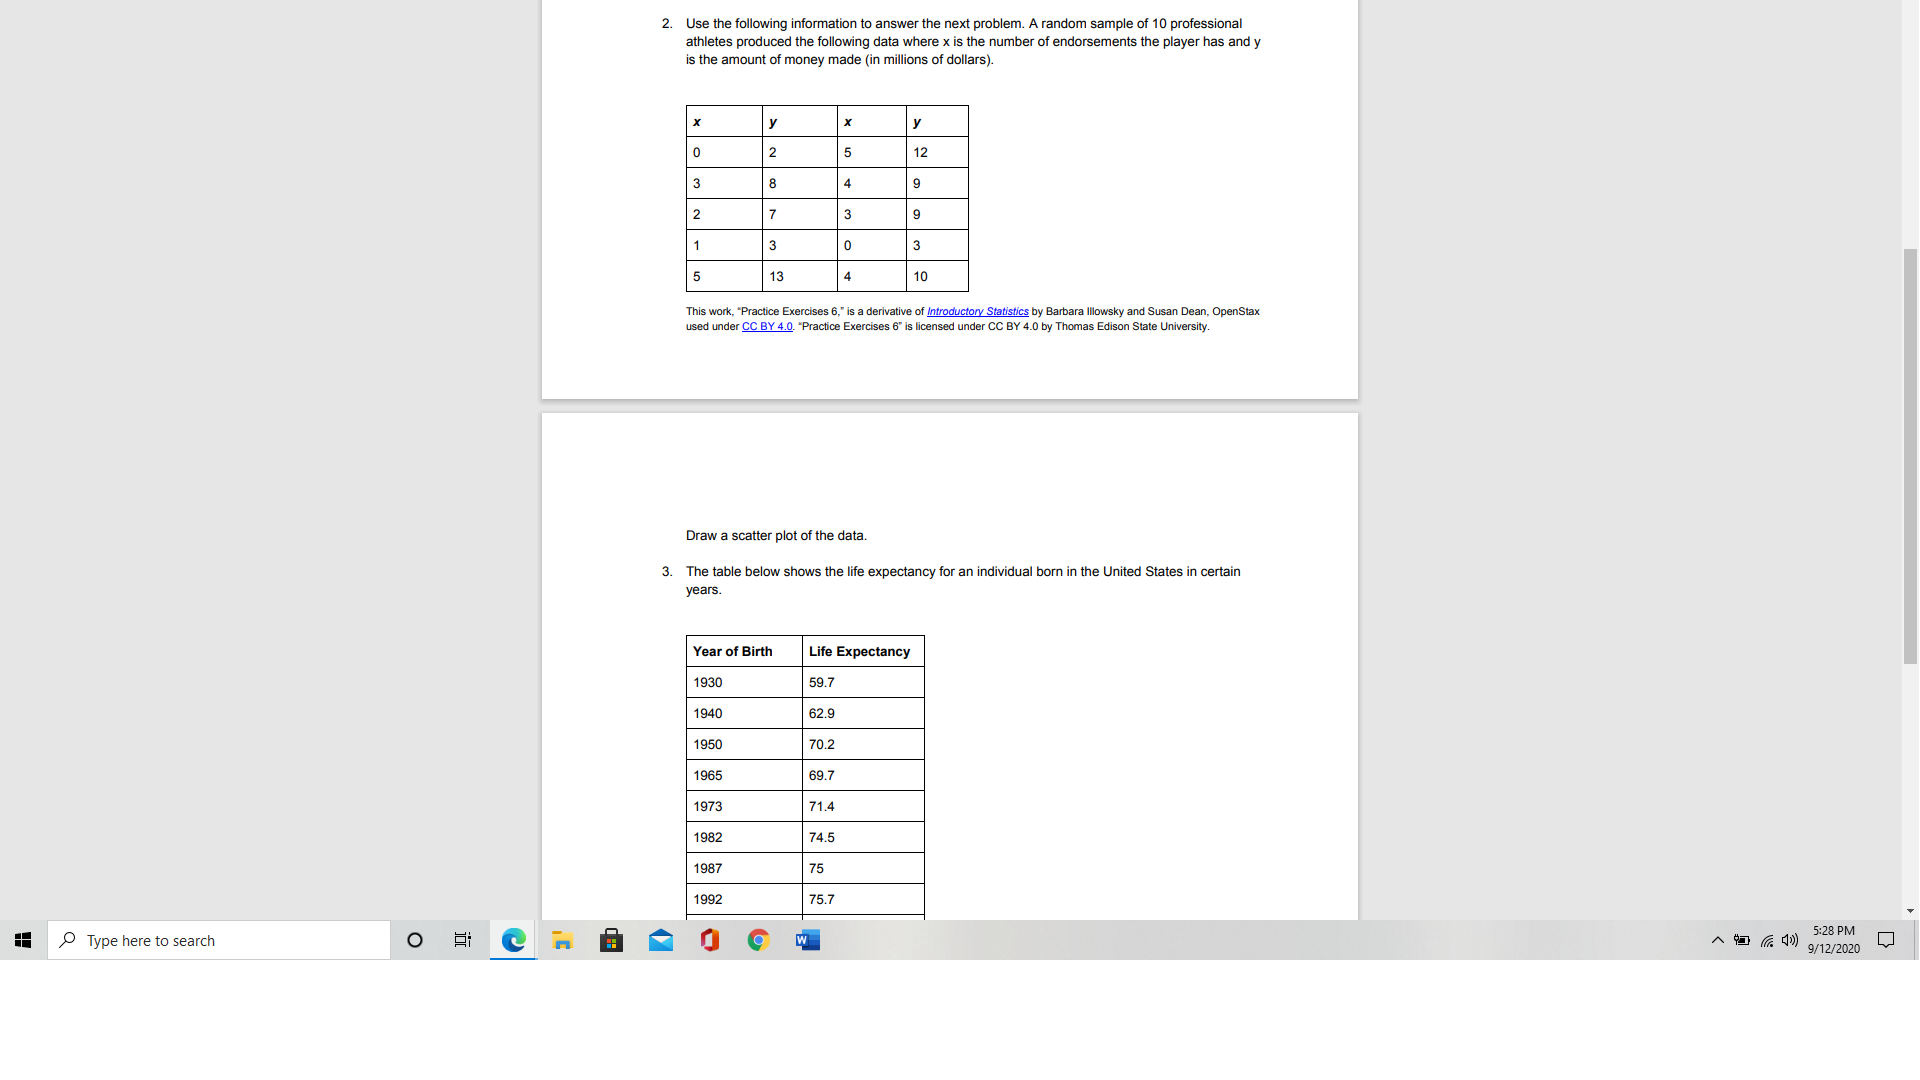
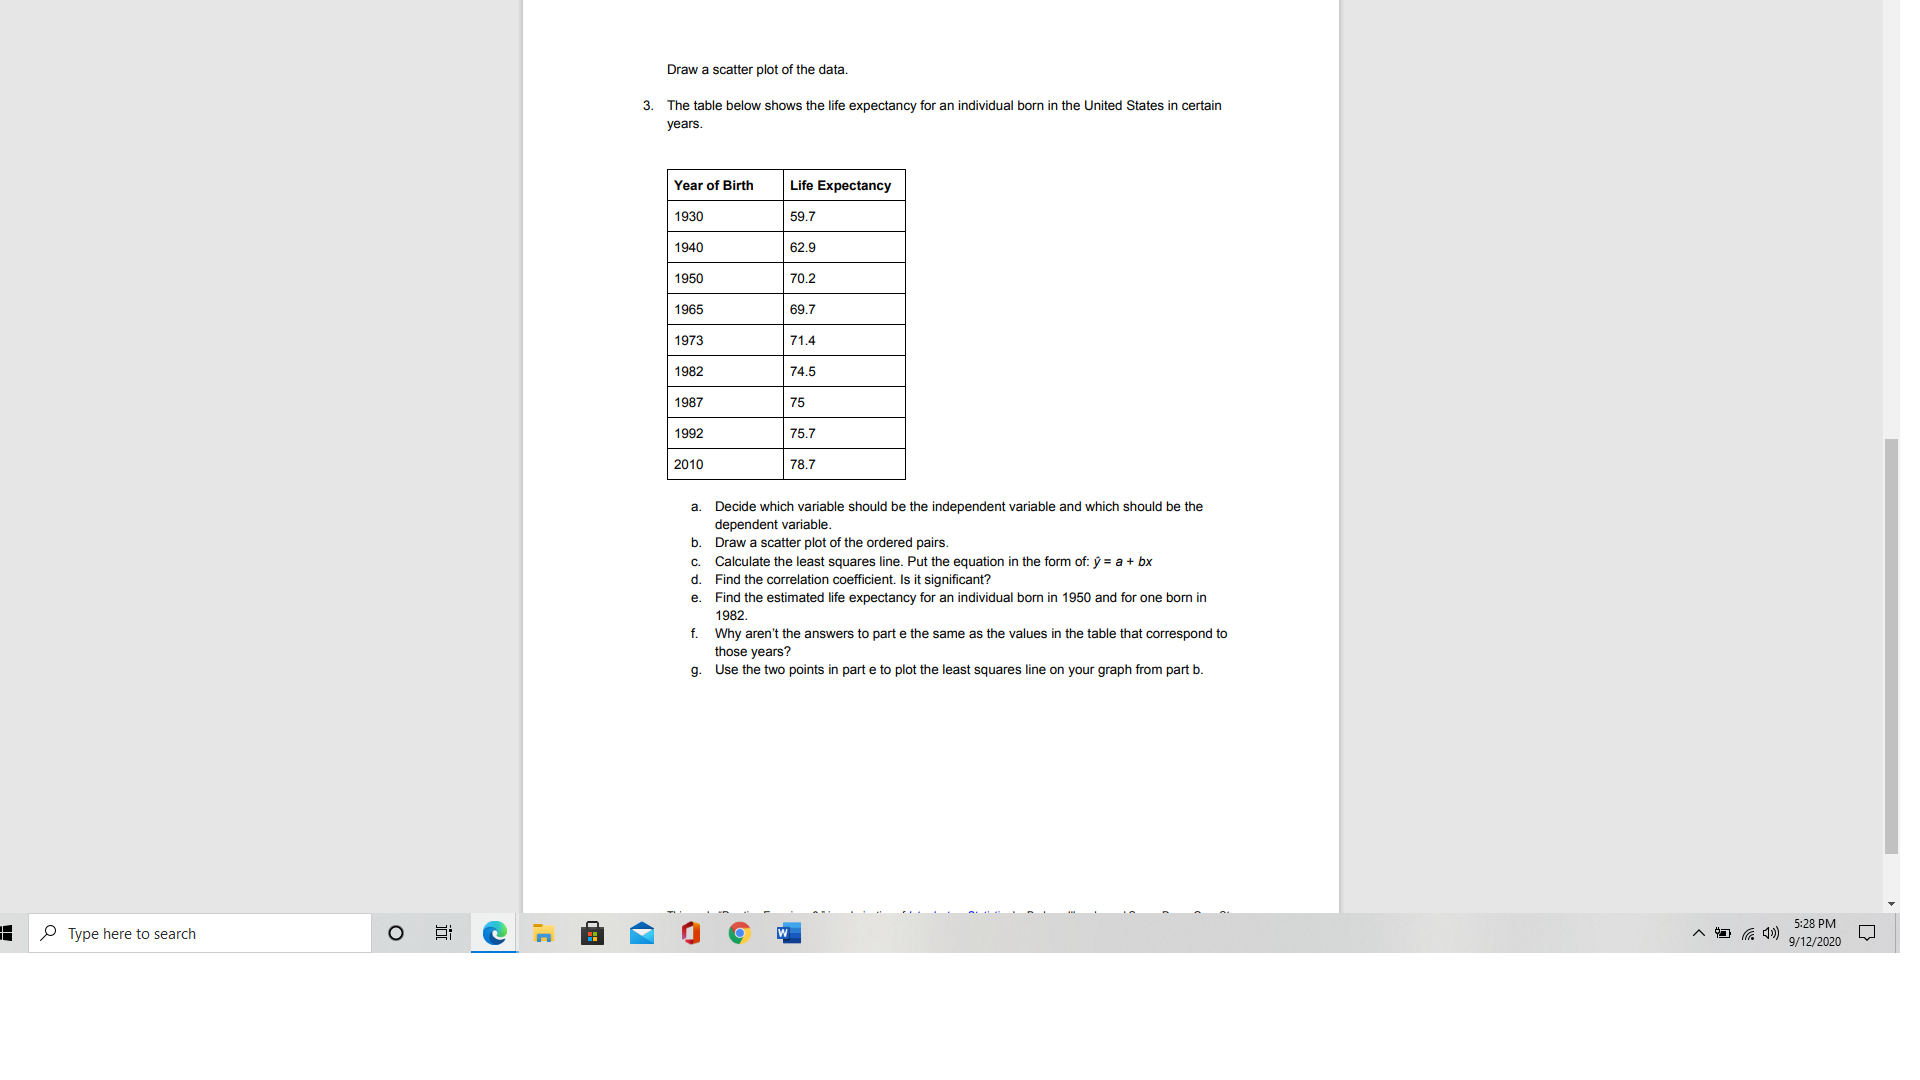
of 2 A Read aloud Draw V Highlight & Erase Practice Exercises 6 Complete the following practice problems. The goal of the practice exercises is to directly engage in course content and to help prepare for the written assignments and the final project. The practice exercises will be scored on completeness and effort of the attempt and not the percent correct. A reasonable and complete submission will receive full credit for the activity. Provide as much evidence as possible for your work on the assignment. Your mentor will provide holistic feedback based on your submission. 1. Does the scatter plot appear linear? Strong or weak? Positive or negative? 7 - 6 - 5 - N 8 2. Use the following information to answer the next problem. A random sample of 10 professional athletes produced the following data where x is the number of endorsements the player has and y is the amount of money made (in millions of dollars). X y X y 0 2 5 12 3 8 4 9 7 3 9 3 0 3 5 13 4 10 This work, "Practice Exercises 6," is a derivative of Introductory Statistics by Barbara Illowsky and Susan Dean, OpenStax used under CC BY 4.0. "Practice Exercises 6" is licensed under CC BY 4.0 by Thomas Edison State University. Type here to search O Fi 9 W 5:26 PM ~ (74 9/12/20202. Use the following information to answer the next problem. A random sample of 10 professional athletes produced the following data where x is the number of endorsements the player has and y is the amount of money made (in millions of dollars). X y X 0 2 5 12 3 8 9 2 7 3 1 3 0 3 5 13 10 This work, "Practice Exercises 6," is a derivative of Introductory Statistics by Barbara Illowsky and Susan Dean, OpenStax used under CC BY 4.0. "Practice Exercises 6" is licensed under CC BY 4.0 by Thomas Edison State University. Draw a scatter plot of the data. 3. The table below shows the life expectancy for an individual born in the United States in certain years Year of Birth Life Expectancy 193 59.7 1940 62.9 1950 70.2 1965 69.7 1973 71.4 1982 74.5 1987 75 1992 75.7 Type here to search O W 5:28 PM ~ 45 ( 4) 9/12/2020Draw a scatter plot of the data. 3. The table below shows the life expectancy for an individual born in the United States in certain years Year of Birth Life Expectancy 1930 597 1940 62.9 1950 70.2 1965 69.7 1973 71.4 1982 74. 1987 75 1992 75.7 2010 78.7 a. Decide which variable should be the independent variable and which should be the dependent variable b. Draw a scatter plot of the ordered pairs c. Calculate the least squares line. Put the equation in the form of: y = a + bx d. Find the correlation coefficient. Is it significant? e. Find the estimated life expectancy for an individual born in 1950 and for one born in 1982. f. Why aren't the answers to part e the same as the values in the table that correspond to those years? g. Use the two points in part e to plot the least squares line on your graph from part b. Type here to search O 5:28 PM ~ () 9/12/2020


