please give a summary of article.
What does this mean for the average investor trying to maximize returns given market risk.
What are the challenges in trying to duplicate Berkshire's portfolio?
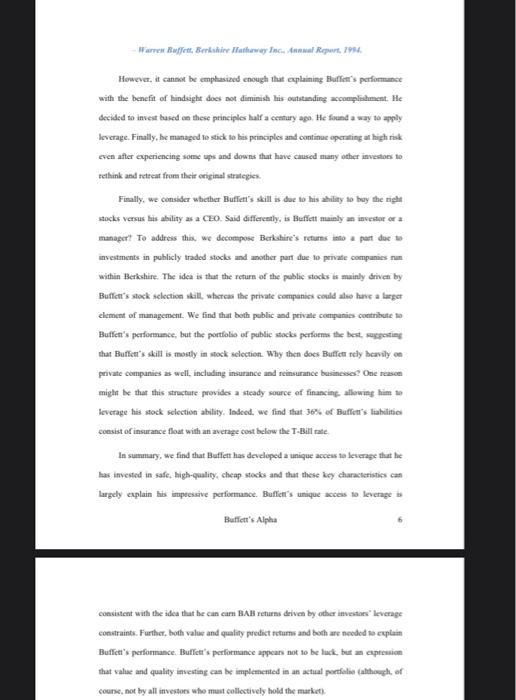
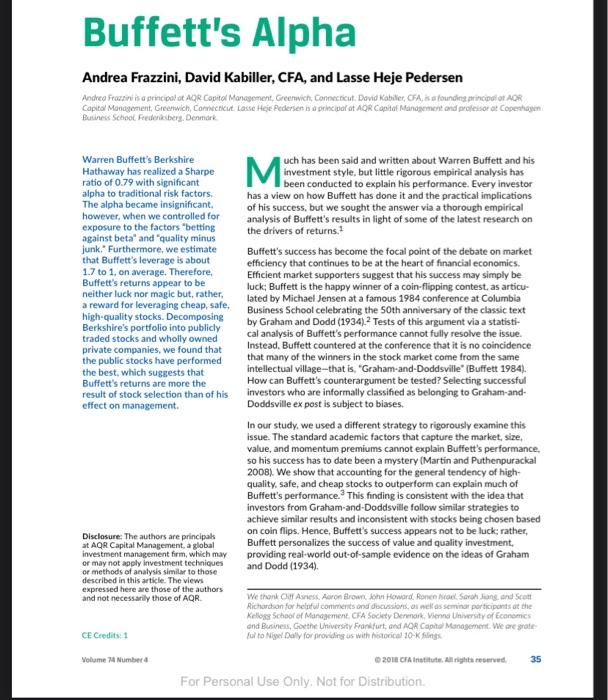
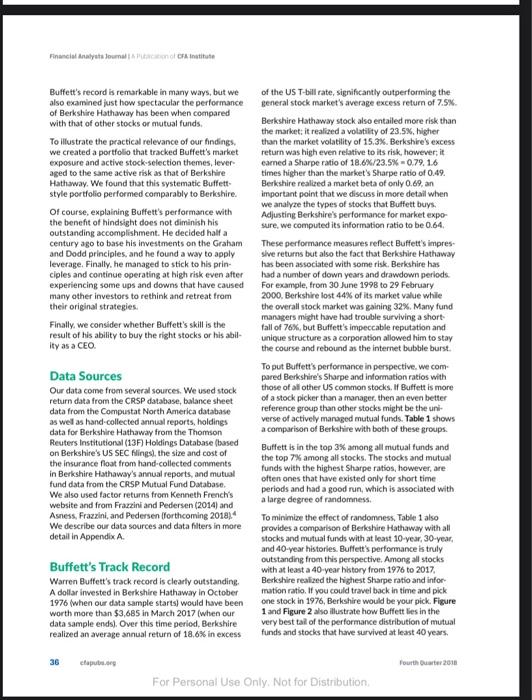
Abstract Berkshire Hathaway has realized a Sharpe ratio of 0.76 , higher than any other stock or mutual fund with a history of more than 30 years, and Berkshire has a significant alpha to traditional risk factors. However, we find that the alpha becomes insignificant when controlling for exposures to Betting-Against-Beta and Quality-Minus-Junk factors. Further, we estimate that Buffett's leverage is about 1.6-to-1 on average. Buffett's returns appear to be neither luck nor magic, but, rather, reward for the use of leverage combined with a focus on cheap, safe. quality stocks. Decomposing Berkshires' portfolio into ownership in publicly traded stocks versus wholly-owned private companies, we find that the former performs the best, suggesting that Buffett's neturns are more due to stock selection than to his effect on management. These results have broad implications for market efficiency and the implementability of academic factors. JEL. Classification: G11, G12, G14, G22, G23 Keywords: market efficiency, leverage, quality, valuc, betting against beta "Aadrea Framini and Dwid Kabiller ane at AQR Capiul Manapencent. Twe Grocnwich Phan, Grenwich, (comssponding auchor) is at New York University. Copcelagon Blasiness School, AQR Capital Management, CEPR, and NBER, e-mail: looderseilstermaguedtr plone: +1-203.742.3758; webc Sarch liang and Scot Richardeon for helpfial coenments and disconions as wall as seminar participunts at the Kellogs School of Management, the CFA Socicty of Denmurk. Vicnne Uaiverity of Ecunomics and Basiness, Gocthe Univenity Frankfurt, and at AQR Cypital Managencht We are grateful to Nigel Dally for ptoviding us with historical 10-K filings 1. Introduction: Understanding the Oracle's Alpha While much has been said and written about Warren Buffett and his investment style, there has been little rigorous empirical analysis that explains his performance. Every investor has a view on how Buffet has done it, but we seck the answer via a thorough empirical analysis in light of some the latest research en the drivers of returms." Buffett's suceess has become the focal point of the debate on market efficiency that continues to be at the heart of financial economies. Ffficient market academics sugeest that his suceess may simply be luck, the happy winner of a coin-flipping contest as articulated by Michacl Jensen at a famous 1984 conference at Colunbia Business School celcbrating the 50 anniversary of the book by Graham and Dodd (1934)2 Tests of this argument via a statistical analysis of the extremity of Buffet's performance cannot fully resolve the issue. Instead, Buffett countered at the conference that it is no coincidence that many of the winners in the stock market come from the same intellectual village. "Graham-and-Doddrville" (Buffett (1984)). How can Buffett's argument be tested? Ex post selecting successful investors who are informally classified to belong to Grahamand-Doddsville is subject to biases. We rigorously examine this argument using a different strategy. We show that Buffett's performance can be largely explained by exposures to value, low-risk, and quality factork. This finding is consistent with the idea Based an the oripinal inaights of Black (1972) and Blask. Joneen, and Schole (1972), Frazrini and Podenes (2013) ahow that kevenge and muryin requitencets change equiliteium riak pecmia. They show hused masurs of "quality," ie, characteriatios that male a compary mots valuable. "The book by Grahan and DodA (194) is crolhed with laying the foumdebion for inceting bued on valo: and quality, and Gralum and Dodd were Buffer's pooteaces at Columbie Buffett's Alpha 2 that investors from Graham-and-Doddsville follow similar strategies to achieve similar results and inconsisteat with stocks being chosen bosed on coin fliph. Hence, Hhuffett's success appeats not to be luck. Rather, Buffett pensonalires the success of value and quality investment, prowiding out-of-sample evidence an the ideas of Graham and Dodd (1934). The fact that both aspects of Graham and Dodd (1934) investing - value and quality - prodict retums 3 is consistent with their bypochesis of limited market efficiency. However, one might wonder whether such factor returns can be acheved by any real life investor after transaction costs and funding costs? The answcr appears to be a clear "yes" based on Buffett's performance and our decomposition of it. Buffett's record is remarkable in many ways, but just how spectacular has the performance of Berkshire Hathaway bece conpared to ocher stocks of emutual funds? Looking at all U.S. stocks from 1926 to 2011 that have been traded for more than 30 years, we find that Berkshire Hathaway has the highest Sharpe ratio among all. Similarly. Buffett has a higher Sharpe ratio than all U.S. mutual funds that have becn around for mote than 30 yearx. So how large is thas Sharpe ratio that has made Buffett oec of the richest people in the world? We find that the Sharpe ratio of Berkshire Hathaway is 0.76 over the period 1976-2011. While nearly double the Sharpe ratio of the ovcrall stuck market, this is lower than many investors imagine. Adjasting for the market exposure, Buffen's information average at documented by Ameas, Frarziai, and Fodersen (2013) and referesess therein. Butfett's Alpha 3 ratio 4 is even lower, 0.66 . This Sharpe ratio reflects high average returns, but alwo significant risk and periods of losses and significant drawdowns. If his Sharpe ratio is very good but not super-human, then how did Buffetr become among the richest in the world? The answer is that Buffent has boosted his neturns by using leverage, and that he has stuck to a good strategy for a very long time period. surviving rough periods where others might have been forced into a fire sale or a career shift. We estimate that Buffett applies a leverage of about 1.6-to-1, boosting both his riak and excess returm in that proportion. Thus, his many accomplishments include having the conviction, wherewithal, and skill to operate with leverage and significant risk over a number of decades. This leaves the key question: How docs Buffet pick stocks to achicve this attractive return stream that can be leveraged? We identify several general features of bis portfolio: He buys stocks that are "xafe" (with low beta and low volatility), "cheap" (ie. value stocks with low price-to-book ratios). and high-quality (meaning stocks that profitable, stable, growing. and with bigh payout ratios). This statistical finding is eertainly consistent with Graham and Dodd (1934) and Buffen's writings, e.e - Whether we're falking abeut sechs ar stocks, I like buxing quality merchamdise when it is marked down - Warrein Buffeth, Berkshire Hathamay Inc, Annual Rrport, L9es. "The lefoenution ratio is defined ar the incecor in a reftenien of moechly cucen wetura divided by ate of the CRSP valoe-weighasd market portlolie. Shape ratios and infirmative neios ast anoliod. Interestingly, stocks with these characteristics - low risk, cheap, and high quality tend to perform well in general, not just the ones that Buffett buys. Hence, perhaps these characteristics can explain Buffett's investment? Or, is his perfommance driven by an idiosyncratic Buffett skill that cannot be quantified? The standard academic factors that capture the market, size, value, and momentum premia cannot explain Buffett's performance so his success has to date been a mystery (Martin and Puthenpurackal (2008)). Given Buffett's tendency to buy stocks with low retum risk and low fundamental risk, we further adjust his performance for the BettingAgainst-Beta (BAB) factor of Framrini and Pedersen (2013) and the Quality Minus Junk (QM) factor of Asness, Framzini, and Pedersen (2013). We find that accounting for these factors explains a large part of Buffetr's performance. In other words, accounting for the general tendency of high-quality, safe, and cheap stocks to outperform can explain much of Buffett's performance and controlling for these factors makes Buffett's alpha statistically insignificant. To illustrate this point in a different way, we create a portfolio thar tracks Buffett's market exposure and active stock-selection themes, leveraged to the same active risk as Berkshire. We find that this systematic Buffett-style portfolio performs comparably to Berkshire Hathaway. Buffett's genius thus appears to be at least partly in tecognizing early on, implicitly or explicitly, that these factors work, applying leverage without ever having to fire sale, and sticking to his principles. Perhaps this is what be means by his modest comment: Ben Gnaham taught me 45 years age that in investing it is not necessary to do extraordinary things to get extrabulinary rowils Buffett's Alpha 5 However, it cannst be emphasiacd cnough that explaining Blaffiter's performunce with the benefit of kindwaght does not diminish lhis outstanding accomplechment. He decided to invest baked en these principles half a century ago. He flound a way to apily Iovcrage. Finally, he managed to stick to bas peinciples and continue opcrating at high riak eqen after experiencing some ups and downs that have caused many other investons to sethink and rctreat frum their ceiginal strategies. Finally, we consider whcther Euffert's skill is doe to his ahility to bay the right sacks versus bis ability as a C2OO. Said differently, is Beffett mainly an inventar or a managort To addross this, we docomapose Berkshire's returns ano a part doe so investments in puhlicly traded stocles and another part due lo private companies nan within Berkshire. The idea is that the return of the pubtie stocks an mainly driven by Buffent's slock seloction whil. whereas the private compankes could also have a largor element of munagement. We find that beth public and peivale companies coetribute to Buffert's performance, but the portfolio of public stocks perfoerms the bent, suysentieg that Buffer's akill is mustly in stock scloction. Why then does Buffee retly beavily an private companies as wcll, including insurance and rcinsurance busincsses? One reasce might be that this stractare frovides a steady source of financinf atlewieg him to loverage has sock scloction ability. Indced. we find that 36% of Buffert's labilitio consist of insurance float with an average cont belivw the T-mill rate. In suanary, we find that Buffett has developed a unique access to leverage that he Mas inveited in safe, high-quality, cheap stocis and that these key characheristies can largely explain his impecssive perfoemance. Bufficti's unique access to leverage as Buffetr's Apha 6 consiatent with the idea that he can carn B.A1s returas deiven by other investore" leverage constraints. Further, both value and quality poedist fotum and both are noodod se coplain Buffet's performance. Buffete's performance appean not to be luck, bet a ceptesaicn that valise and quality inseating cas be implemented in an astual portholas (althoxph, of couns, not by all inverton who mant colloctively hold the market). Andrea Frazzini, David Kabiller, CFA, and Lasse Heje Pedersen Capital Mandgoment, Greetwich, Cambecticut Lasse Heie Pedersen is a principal at AQR Capital Management and profeisor at Coperhagen Butines School. Federiabert. Denthark. Warren Buffett's Berkshire uch has been said and written about Warren Buffett and his Hathaway has realized a Sharpe investment style, but little rigorous empirical analysis has ratio of 0.79 with significant been conducted to explain his performance. Every investor alpha to traditional risk factors. has a view on how Buffett has done it and the practical implications The alpha became insignificant, of his success, but we sought the answer via a thorough empirical however, when we controlled for analysis of Buffett's results in light of some of the latest research on exposure to the factors "betting the drivers of returns." against beta" and "quality minus junk." Furthermore, we estimate Buffett's success has become the focal point of the debate on market that Buffett's leverage is about efficiency that continues to be at the heart of financial economics. 1.7 to 1, on average. Therefore, Efficient market supporters suggest that his success mary simply beBuffett's returins appear to be luck; Buffett is the happy winner of a coin-flipping contest, as articu. neither luck nor magic but, rather, lated by Michael Jensen at a famous 1984 conference at Columbia a reward for leveraging cheap, safe, Business School celebrating the 50th anniversary of the classic text high-quality stocks. Decomposing by Graham and Dodd (193A)2 2 Tests of this argument via a statistiBerkshire's portfolio into publicly cal analysis of Buffett's performance cannot fully resolve the issue. traded stocks and wholly owned private companies, we found that Instead. Buffett countered at the conference that it is no coincidence prome the public stocks have performed that many of the winners in the stock market come from the same the best, which suggests that intellectual village-that is, "Graham-and-Doddsville" (Buffett 1984). Buffett's returns are more the How can Buffett's counterargument be tested? Selecting successful result of stock selection than of his investors who are informally classified as belonging to Graham-andeffect on management. Doddsville ex post is subject to biases. In our study, we used a different strategy to rigorously examine this issue. The standard academic factors that capture the market, size, value, and momentum premiums cannot explain Buffett's performance, so his success has to date been a mystery (Martin and Puthenpurackal 2008). We show that accounting for the general tendency of highquality, safe, and cheap stocks to outperform can explain much of Buffett's performance. 3 This finding is consistent with the idea that investors from Graham-and-Doddsville follow similar strategies to achieve similar results and inconsistent with stocks being chosen based on coin flips. Hence, Buffett's success appears not to be luck: rather, Disclosure: The authors are principals Buffett personalizes the success of value and quality investment. at AQR Capital Management, a global investment management firm, which may providing real-world out-of-sample evidence on the ideas of Graham or may not apply investment technieues and Dodd (1934). or methods of analysis similur to those described in this article. The view: expressed here are those of the authors and not necessarily those of AQR. Aichandsan for helyful comirients ond docissiors, ai ncil as seminar porticiponts at the Kellogs Schoot of Mandgement. CFA Society Denenark. Vienns Univerity of Ecanemes end Besines, Goethe Utiversity Frand furt, and MOR Capita Manogement. We are grate CECredits: 1 ful to Wiker Daly for groviding us with hotorical 10K filingi Velume 3 Number 4 D 201e cra institute, all righta reservet. 35 Buffett's record is remarkable in many ways, but we of the US T-bill rate, significantly outpertorming the also examined just how spectacular the performance general stock market's average excess return of 7.5%. of Berkshire Hathawdy has been when compared with that of other stocks or mutual funds. Berkshire Hathaway stock also entailed more risk than the market: it realized a volatility of 23,58 , higher To illustrate the practical relevance of our findings, than the market volatility of 15,3. Berkshire's excess we created a portfolio that tracked Buffett's market refurn was high even relative to its risk, however; it exposure and active stock-selection themes, lever- earned a Sharpe ratio of 18.6%/23.5%=0.79.1.6 aged to the same active risk as that of Berkshire times higher than the market's 5harpe ratio of 0.49. Hathaway. We found that this systematic Buffett- Berkshire realized a market beta of only 0.69 , an style portiolio performed comparably to Berkshire. important point that we discuss in more detail when Of course, explaining Buffett's performance with W analyze the types of stocks that Butfett buys. Adjusting Berkshire's performance for market expothe benefit of hindsight does not diminish his Adjusting Berkshires performance formarketexpooutstanding accomplishment. He decided half a century ago to base his investments on the Graham These performance measures reflect Buffett's impresand Dodd principles, and he found a way to apply slve returns but also the tact that Berkshire Hathaway leverage. Finally, he managed to stick to his prin- has been associated with some risk. Berkshire has ciples and contince operating at high risk even after had a number of down years and drawdown periods. experiencing some ups and downs that have caused For example, from 30 June 1998 to 29 February many other investors to rethink and retreat from 2000 . Berkshire lost 44% of its market value while their original strategies. the overall stock market was gaining 32\%. Many fund Finally, we consider whether Buffett's skill is the managers might have had trouble surviving a shortresult of his ability to buy the right stocks or his abil- unicue structure as a corporation allowed him to stay ity as a CEO. the course and rebound as the internet bubble burst. To put Buffett's performance in perspective. we com- Data Sources Our data come from several sources. We used stock those of all other US common stocks. If Buffett is more return data from the CRSP database, balance sheet of a stock picker than a manager, then an even better data from the Compustat North America database reference group than other stocks might be the unas wel as hand-collected annual reports, holdings verse of actively manogod mutual funds. Table 1 shows data for Berkshire Hathaway from the Thomson a comparison of Berkshire with both of these groups. Reuters Institutional (13F) Holdings Database fbased Buffett is in the top 3% among all mutual funds and on Berkshire's US SEC Hlings), the size and cost of the insurance foat from hand-collected comments the top 7m among all stocks. The stocks and mutual in Berkshire Hathaway's annual reperts, and mutual funds with the highest Sharpe ratios, however, are fund data from the CRSP Mutual Fund Database. often ones that have existed only for short time We also used factor returns from Kenneth French's periods and had a good run, which is associated with website and from Frazzini and Pedersen (2014) and Asness, Frazzini, and Pedersen (forthcoming 2018) 4 To minimize the effect of randomness, Fable 1 also We describe our data sources and data filters in more provides a comparison od Berkshire Hathaway with all detail in Appendix A. stocks and mutual funds with at least 10 -year, 30 -year, and 40 -year histories. Buffett's performance is truly Buffett's Track Record outstanding from this perspective. Among all stocks with at least a 40 -year history from 1976 to 2017, Warren Butfett's track record is clearly outstanding. Berkshire realized the highest 5harpe ratio and inforA dollar invested in Berkshire Hathaway in October mation ratio. If you could travel back in time and pick. 1976 (when our data sample starts) would have been one stock in 1976, Berkshire would be your pick. Figure worth more than $3,685 in March 2017 (when our 1 and Figure 2 also llistrate how Buffett lies in the data sample ends), Over this time period, Berkshire very best tall of the performance distribution of mutual realized an average annual return of 18,6% in excess funds and stocks that have survived at least 40 years. 36 efaputa.seg Fourth puarter 2618


